A market crash is commonly considered a fall of 20% or more before share prices recover.
A market correction is less severe, generally considered to be a fall of 10% or more before prices recover.
A market crash and correction are not the same as the financial term ‘volatility‘, which is often described as the random ups and downs in prices. Volatility of between 1% and 3% is common.
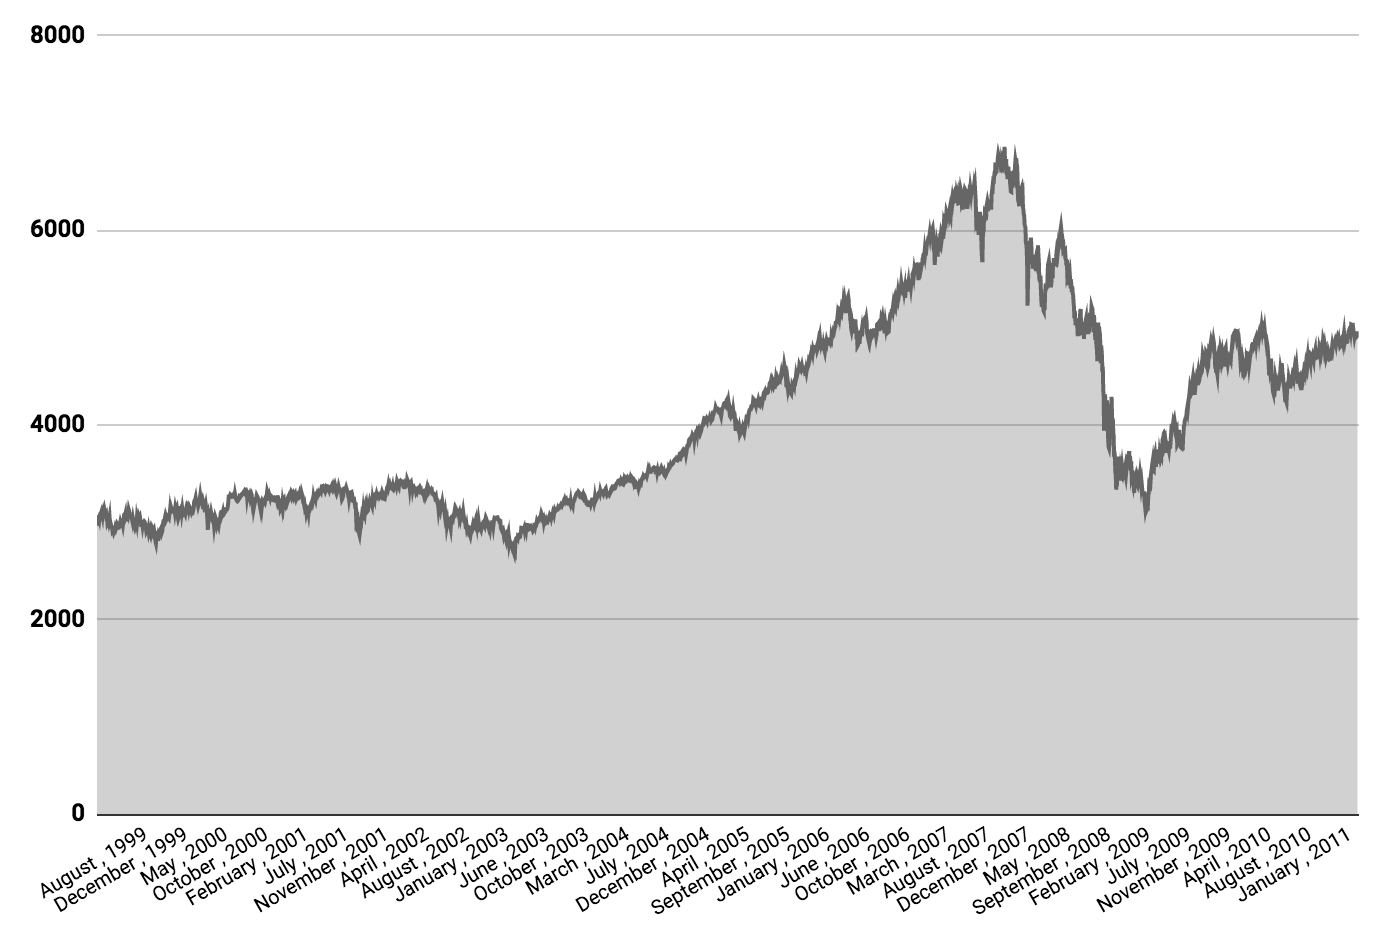
Australia’s All Ordinaries Over 20 Years

The chart above shows Australia’s share market or the All Ordinaries (INDEXASX: XAO) (ASX: XAO) over 20 years. Can you spot the crashes and corrections?
Prominent Market Crashes
Here are some of the most prominent share market crashes:
- Global Financial Crisis (GFC), 2007/2008
- Dot-com boom and bust, 2000
- ’97 Asian financial crisis
- Black Monday, 1987
- 1973-74 stock market crash
- 1929 crash
- Tulip mania crash, 1637
What causes share market crashes?
Some investors believe share markets move in cycles depending on Fibonacci sequences, the US presidential cycle, wave theory and other mathematical and technical formula.
However, some investors argue that market crashes cannot be predicted but should instead be expected to occur every 7 to 10 years.
How often do markets correct?
Investment firm Deutsche Bank conducted a study which found that markets experience a correction about once a year — every 357 days. Once a year, on average.
How often do markets crash?
In his book, Unshakeable, Tony Robbins, writes, “it turns out that fewer than one in five corrections escalate to the point where they become a bear market.”
“To put it another way, 80% of corrections don’t turn into bear markets.” – Tony Robbins
A Free Lunch: How Diversification Works
Nobel prize winner, Harry Markowitz, described ‘diversification’ as the “the only free lunch in finance”.
The video above explains the concept.
[ls_content_block id=”14945″ para=”paragraphs”]


