In this article, I’ll detail why we think it’s time for Australian investors to look at the opportunities in the Indian share market.
Why India?

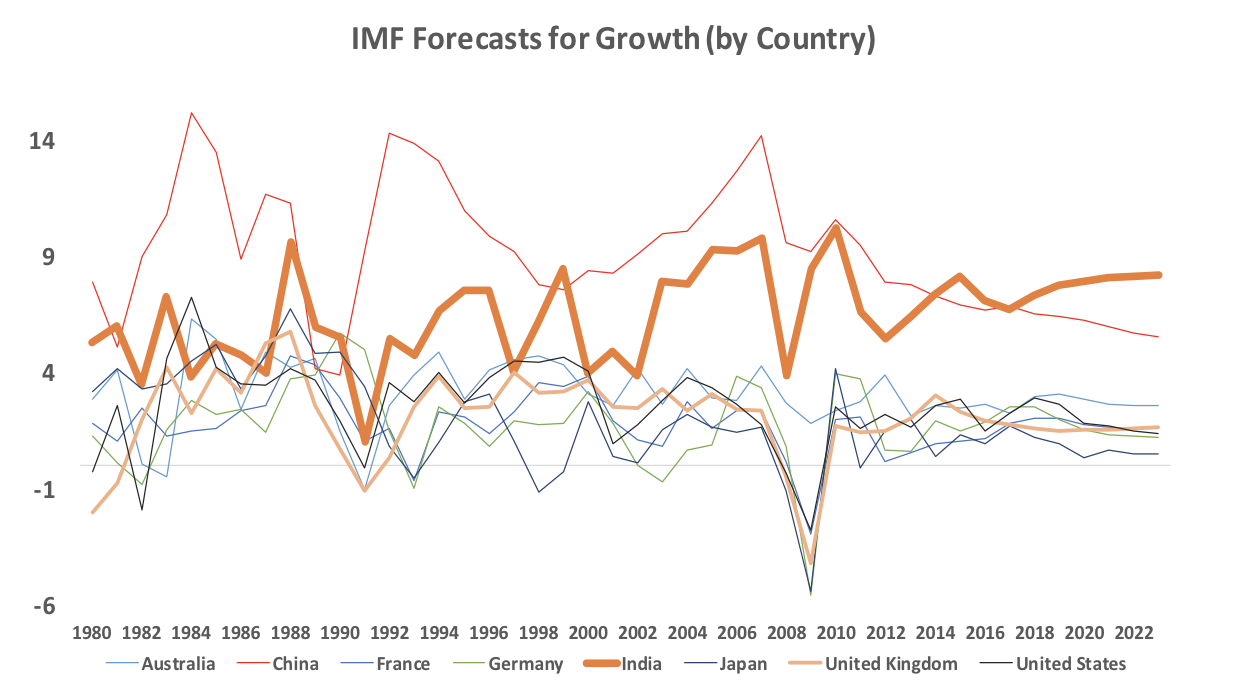
The International Monetary Fund (IMF), an agency which fosters global monetary cooperation amongst countries, forecasts that global GDP will grow by 3.8% over the next six years.
Most developed countries like the US, Europe, Japan and UK are now growing at a more mature pace of 1.9%, driven by productivity rather than population growth, greater infrastructure or exports. However, the emerging economies of the world are forecast to grow at a much faster pace (5.0%), driven by stronger population growth, greater infrastructure and development and increasing exports from lower cost of wages.
Some geographies are in a sweet spot, enjoying growing consumption, investment and government spending and a pick up in their exports. India is one such geography where the IMF forecasts growth to range between 7-8% p.a. over the next 5 years. This is being driven by consumption patterns and infrastructure requirements of India’s large (1.3bn) and youthful population (50% are aged 26 or below).
India’s GDP per capita is coming from a low base (Dec 2017: US$1,983) and by 2030 is expected to rise to over US$4,000, given GDP is growing faster than the population. India will be the world’s third largest economy at some point between 2025-2030.
In fact, when we compare China to India, we note that India is where China was in 2004 in terms of GDP per capita. However, there are unique differences between the China story and the India story, particularly for an Australian investor.
China Or India?
| India | China | |
| Population | 1.3bn | 1.6bn |
| Political System | Democracy | Communism |
| Legal System | English Law | Local Law |
| Diversification to Australia | Low economic dependence | High economic dependence |
| Growth Story | Driven by consumption and services | Driven by manufacturing and exports |
| Stock Market | Owned by Private Entrepreneurs
IT, Banks, Consumption and Infrastructure |
Highly Government owned
Banks, Technology and State-owned Enterprises |
It’s not necessary that strong GDP growth translates to share market returns
Empirical evidence from over 100 years of research by Dimson, Marsh, Staunton et. al points to the fact that high GDP growth and share market returns are in fact slightly negatively correlated.
However, there is a relationship between forecast GDP growth as you would expect. The relationship is dependent on many factors. Firstly, GDP does not necessarily correlate with the product of the corporate listed economy and can be driven by debt, private equity or infrastructure.
Secondly, share market returns can also be driven by many other factors such as valuations, sentiment, fiscal and monetary policy, regulation and politics to name a few. A key to this question can be how privatised the economy is relative to central or state ownership.
India’s economy is largely privatised (free of government interference) relative to an economy like China for example. We think that the relationship between the GDP opportunity and share markets is more likely to hold closer (than markets like China), which has been illustrated in the past and going forward from this point.
Taking Advantage of India’s Growth
As investors we tend to think it is safer to invest in Emerging Markets shares as a group rather than individual countries, given greater diversity in political regimes, economic reforms, business conditions, fiscal and monetary policy changes and currencies.
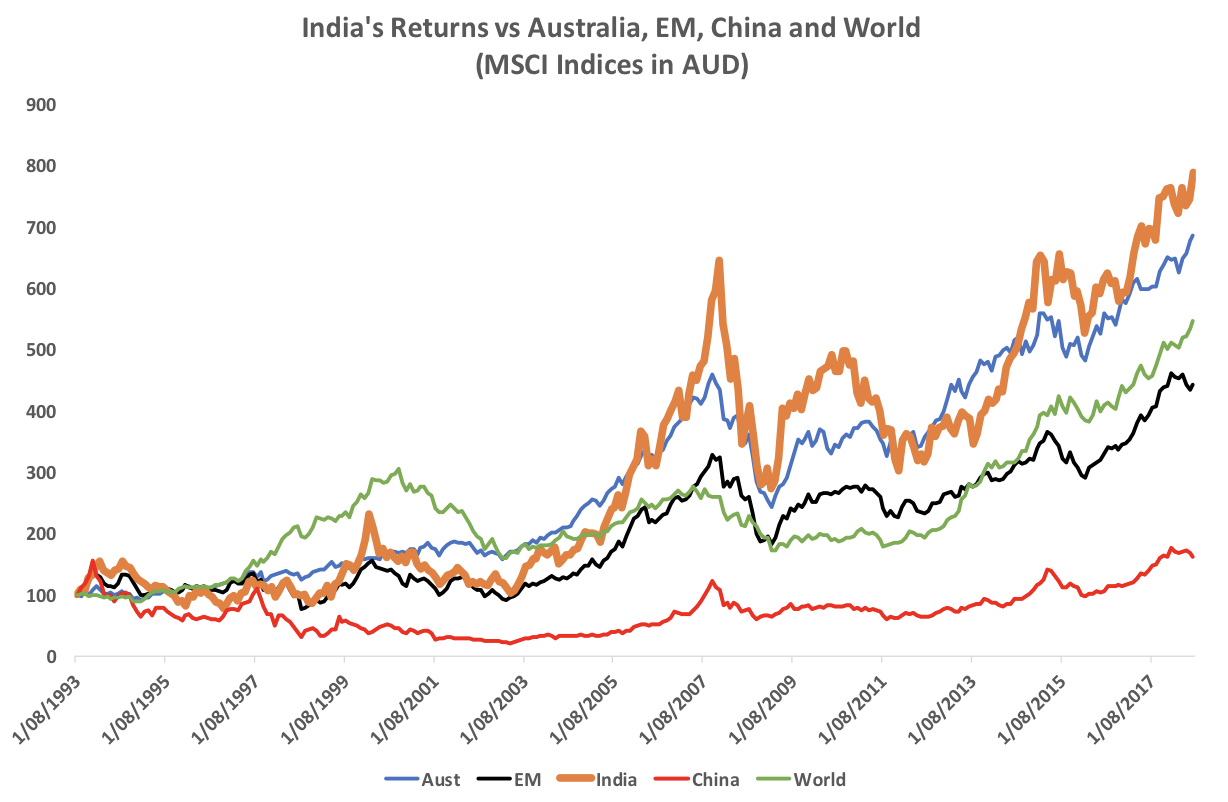
However, having too much diversity can wash away sustainably strong returns from structural change simply for the sake of managing downside risk. In combination with the best companies in Global and Australian share portfolios, an allocation to Indian shares might provide a far superior risk-return combination compared to investing in a diversified Emerging Markets portfolio. From a risk-return perspective, the following table is a telling statistic:

Not only have returns from India over time been quite strong relative to Emerging Markets, its also had much lower correlation to typical investments for Australian Superannuation clients such as Australian shares and Global shares. Investors ideally seek high returning, low correlation investments to add to a portfolio to improve its risk-return characteristics.
Risk & Return Characteristics Of India
| 5 Year Return 31 July 2018 (AUD) | India | Emerging Markets |
| 15.3% p.a. | 9.6% p.a. | |
| Rolling 3 Year Correlation in AUD (25 years) | ||
| MSCI World | 0.33 | 0.59 |
| ASX 200 | 0.33 | 0.63 |
Why do the world’s most respected investors like India?
Most investors with a strong pedigree have understood the potential of India due to its fundamentals. We highlight below some quotes from well-known investors made over the last few years:
Warren Buffett, Berkshire Hathaway (May 2017): “I think the potential for India is incredible as it is a huge, enormous market”.
Kerr Neilsen, Platinum Asset Management (July 2015): “we like India simply because we feel the economy is deregulating, allowing the individual and private sector to really prosper”.
Ray Dalio, Bridgewater & Associates: (December 2017): “projecting India as having the highest economic growth in the world over the next ten years. The structural reforms initiated are great”.
Mark Mobius, ex-Templeton (now Mobius Capital Partners): (August 2018): is bullish on the Indian economy and thinks that growth rate will surpass China sustainably if the reforms continue to kick in. He continues to be bullish on consumption and looks to have a 20% allocation to India in his new fund.
The best way to understand the growth story of India is through its companies
In our future articles, we will highlight the India story through the lens of its companies.
Quite often a great top-down story economic story (like I’ve detailed here) doesn’t translate into a need to invest in overseas shares. Therefore, we will compare great Australian and Indian companies side-by-side to illustrate the benefits of a country with a large and youthful population like India.
This article was written by Mugunthan Siva, Managing Director of India Avenue Investment Management (AFSL: 478 233).
Get More Insights From India Avenue
Disclaimer: This article contains general information only and should not be relied upon. The information does not take into account your needs, goals or objectives, so consult a licensed and trusted adviser before you act on the information. Past performance is not a reliable indicator of future performance.
Sources:
- Chairman of the Economic Advisory Council to the Prime Minister, India – Bibek Debory (Dec 2017)
- Centre of Economic Business and Research (CEBR, UK) 2016
- Dimson, Marsh and Staunton, London Business School and Credit Suisse


