The S&P/ASX 200 (INDEXASX: XJO) (ASX: ^AXJO) sank 2.3% today, it’s the worst performance in… a while.
(cheeky confession: in truth, I hadn’t checked what the ASX 200 was doing until about 6 pm).
The worst performers in the ASX 200 were:
- WiseTech Global Ltd (ASX: WTC) – down 4.8%
- Treasury Wine Estates Ltd (ASX: TWE) – down 5.6%
- Cochlear Ltd (ASX: COH) – down 5%
- ANZ Banking Group (ASX: ANZ) – down 4.2%
Conversely, the best performers in the ASX 200 are all gold stocks:
- Northern Star Resources Ltd (ASX: NST) – up 2.7%
- Evolution Mining Ltd (ASX: EVN) – up 2.5%
- Newcrest Mining Ltd (ASX: NCM) – up 1.6%
- Regis Resources Ltd (ASX: RRL) – up 5.2%
What Happened?
According to The Motley Fool, US technology shares moved sharply lower on Friday because the government could be about to lay charges against hackers from China. This follows the arrest of the executive from China’s smartphone maker, Huawei.
Meanwhile…
“Australian markets continue to be buffeted by global developments, in particular weakness in US equity markets,” said NAB’s top forecaster, Ivan Colhoun.
As a result, Mr Colhoun said the market is not pricing in an upwards move to interest rates in Australia before 2020.
Around the corner, The New Daily reported concerns over US market growth following the trade tensions was weighing on sentiment.
Finally, traders relying on candles, price charts and volume say the market could be about to rebound given a similar ‘V-shape’ pattern to the 2016 market sell-off.
In summary: maybe something to do with the US but no-one knows for sure.
What Now?
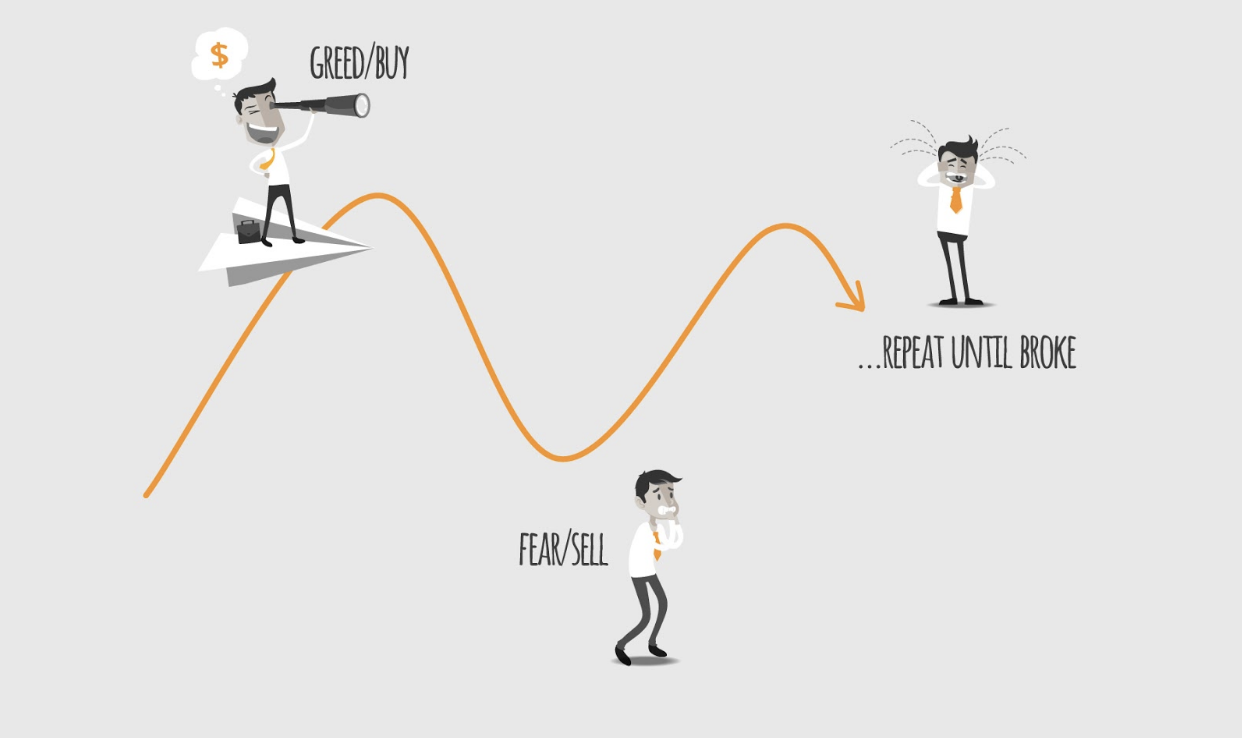
When asked whether they would like to have share prices fall or rise over the next 5 years, most investors will answer “rise”.
Yet when asked whether they are short-term or long–term investors, most people will say “long-term”.
Clearly, there is a disconnect.
Long-term investors need days like today to make money because days like today offer us the best opportunities.
Indeed, knowing the difference between volatility (the random ups and downs) and proper business risk (e.g. bankruptcy) is perhaps the single greatest advantage any individual can have.
The Only Chart I Trust
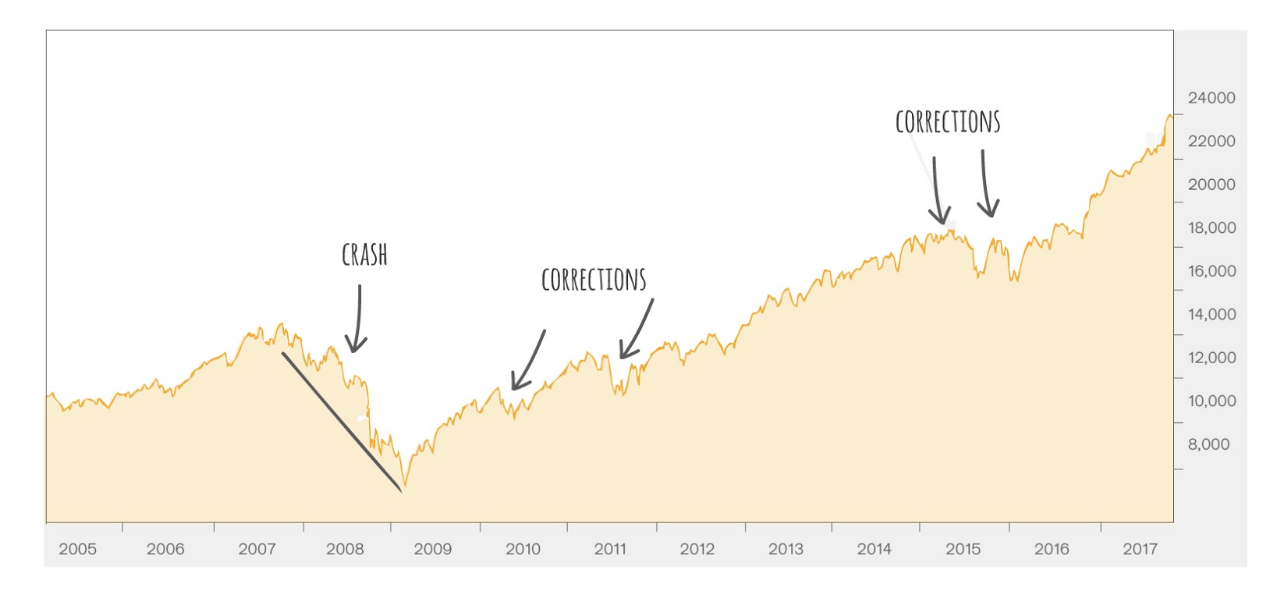
There is only one chart I trust when it comes to investing my own money and unearthing my best share ideas for our members at Rask Invest.
The chart above shows you the USA’s Dow Jones over more than 10 years. As you can see, there have been quite a few “corrections” and one big crash since 2004.
But what else do you notice?
From bottom left to top right, the market goes… [drumroll] up!
It’s the same over virtually all long-term horizons. Of course, over the short-term, it’s anyone’s guess.
Fun Fact
US stock prices experienced a correction (read: “10% fall before recovering to higher levels”), on average, once a year between 1957 and 2014. In that time, the market went up.
Once a year — or every 357 days.
That’s according to data from Deutsche Bank.
I repeat: Once a year (on average)!
What Now?
I — like everyone else — do not have a crystal ball and I cannot tell you where the ASX 200 will end tomorrow, next month or next year.
But what I can say is this:
For centuries, businesses have been making money.
And I see no reason for that to change (remember, shares are just part ownership of a business).
Should I be Buying Shares?
Sure, the ASX 200 might fall. Commonwealth Bank of Australia (ASX: CBA) and ANZ Bank shares might fall too.
But if you:
a) truly are a long-term investor (5+ years), and
b) have six months of living expenses put aside for emergencies and have your debt under control, and
c) can invest regularly because you have a stable job, and
d) are curious about how the world works and how to make more money
…then the sharemarket is absolutely where you should consider being invested today, tomorrow and the rest of 2018 and beyond.
If you’re looking for 3 proven ASX shares (by that I mean dividends + capital gains) please keep reading…
[ls_content_block id=”14945″ para=”paragraphs”]


