Commonwealth Bank of Australia (ASX: CBA) has reported its FY19 result to the market, is the share price a buy?
Commonwealth Bank of Australia or CBA is Australia’s largest bank, with commanding market share of the mortgages (24%), credit cards (27%) and personal lending markets. It has 16.1 million customers, 14.1 million are in Australia. It is entrenched in the Australian payments ecosystem and financial marketplace.
What CBA Reported In Its FY19 Result
CBA reported that its statutory net profit after tax (NPAT) (including discontinued operations) fell by 8.1% to $8.57 billion. Slightly better was the fact that continuing cash net profit only fell by 4.7% to $8.49 billion.
The bank experienced a 2% fall of its operating income. On the positive side there was core volume growth, but the net interest margin (NIM) fell by 0.05% compared to FY18 to 2.1% although it was flat compared to the first half of FY19. The bank also blamed fee changes and weather events for the income fall.
Operating expenses increased by 2.5% due to remediation costs, elevated risk / compliance and an increase of investment spending.
A combination of lower income and higher expenses is not good for profit.
In terms of its credit quality, ‘troublesome and impaired assets’ increased by $1.1 billion in the second half of FY19 to $7.8 billion. The loan impairment expense was $1.2 billion, an increase of 11% on FY18.
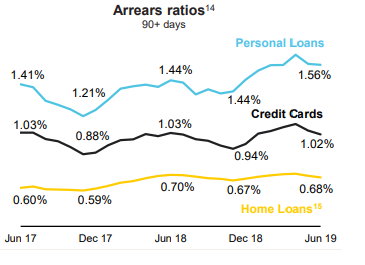
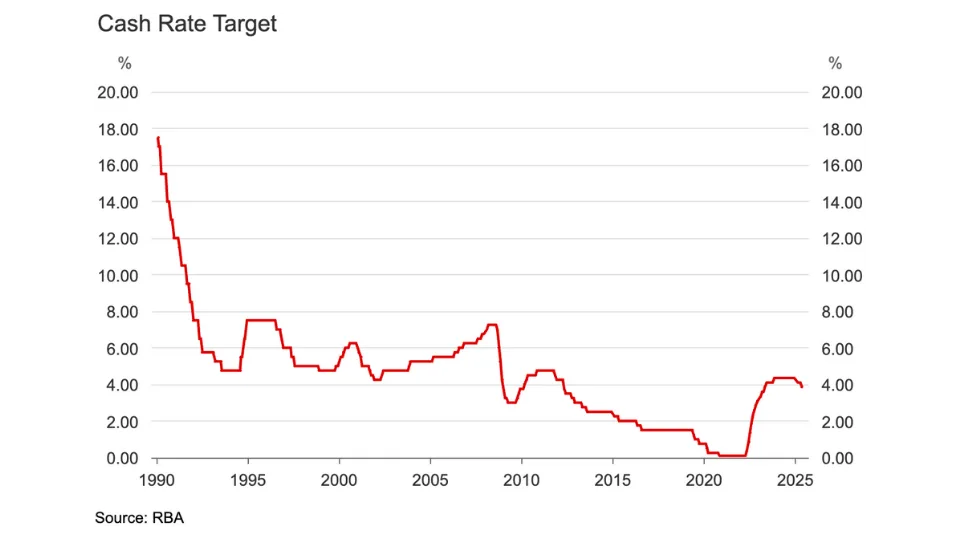
CBA’s 90+ day mortgage arrears decreased slightly from 0.70% at June 2018 to 0.68% at June 2019. It had been trending higher over the previous years, so it’s good to see that the various measures like the RBA’s first interest cut rate may have helped.

CBA Dividend And Balance Sheet
CBA has declared a final dividend of $2.31 per share, flat on last year’s final dividend. This brings the total dividend to $4.31 per share, also flat on last year. The current fully franked dividend yield is now 5.4%.
Due to the decrease in cash net profit, the full year dividend payout ratio increased to 88%.
The bank’s CET1 ratio improved from 10.1% last year to 10.7% at June 2019, above the 10.5% ‘unquestionably strong’ benchmark set by APRA.
CBA Management Comments
CBA CEO Matt Comyn said: “We have simplified our business including through the sale of Sovereign, TymeDigital, Count Financial and Colonial First State Global Asset Management, and have announced our exit from aligned advice.”
“While this year’s headline results were impacted by customer remediation costs, revenue forgone for the benefit of customers and elevated risk and compliance expenses, our core business continued to perform well – underpinned by growth in home lending, business lending and deposits. The Group’s balance sheet also remained a key strength. Deposits provided 69% of the Group’s total funding.”
Is The CBA Share Price A Buy?
Most shareholders will be glad to see that the dividend was maintained. However, with the fall in profit it’s valued at above 16 times the FY19 earnings. This doesn’t seem like great value, it really depends if the bank grows profit from here.
I’m not sure on profit growth in the short term either, although Royal Commission remediation and costs should slow down now.
Instead of CBA I’d rather buy the reliable shares in the free report below instead.
[ls_content_block id=”14945″ para=”paragraphs”]
[ls_content_block id=”18380″ para=”paragraphs”]


