The Netwealth Group Ltd (ASX: NWL) share price is storming higher today as the market reacts to the company’s FY20 results. At the time of writing, Netwealth shares have jumped more than 9% to $14.19.
Netwealth is a financial services technology company that helps financial planners manage client money in a user-friendly way, whilst also reporting and charging for services. The founding Heine family still own more than half of the company.
What did Netwealth report?
Netwealth grew funds under management (FUM) by 84.4% to $7.3 billion, supported by FUM net inflows of $3.7 billion.
Funds under administration (FUA) increased by 35% to reach $31.5 billion, this despite $0.9 billion of negative market movements. Netwealth recorded FUA net inflows of $9.1 billion for the year, more than double the inflows seen in FY19.
The company said its FUA growth was driven by both new and existing financial intermediaries. The continued migration of accounts from Netwealth’s existing financial intermediaries accounted for roughly 56% of the FUA added in FY20. The remaining 44% came from new financial intermediaries, with Netwealth adding 264 net new intermediaries to its platform during FY20.
Netwealth reported total income of $123.9 million, up 26% compared to FY19. The company finished the year strongly, with second-half income jumping 29% over the prior corresponding period and 11% over 1H20.
Netwealth predominantly generates income from platform revenue, which comprises administration fees, ancillary fees, transaction fees, and management fees. As expected, administration fees made up majority of platform revenue – 53%. However, this was lower than the 57% contribution in FY19 as ancillary fees and transaction fees in particular were greater contributors to the FY20 result.
Earnings
Operating expenses increased relatively in line with income, up 26%, as the company continued to invest in IT infrastructure, people and software.
This led to EBITDA of $64.8 million, an increase of 25% for the year. Netwealth’s EBITDA margin was relatively flat over FY19, coming in at 52.3%.
The company reported impressive cash generation, with pre-tax net operating cashflow of $64.5 million, representing 99.4% of EBITDA.
Finally, on the bottom line, Netwealth achieved statutory net profit after tax (NPAT) of $43.7 million, up 27% compared to FY19. On an underlying basis, NPAT grew by 22%.
Market share
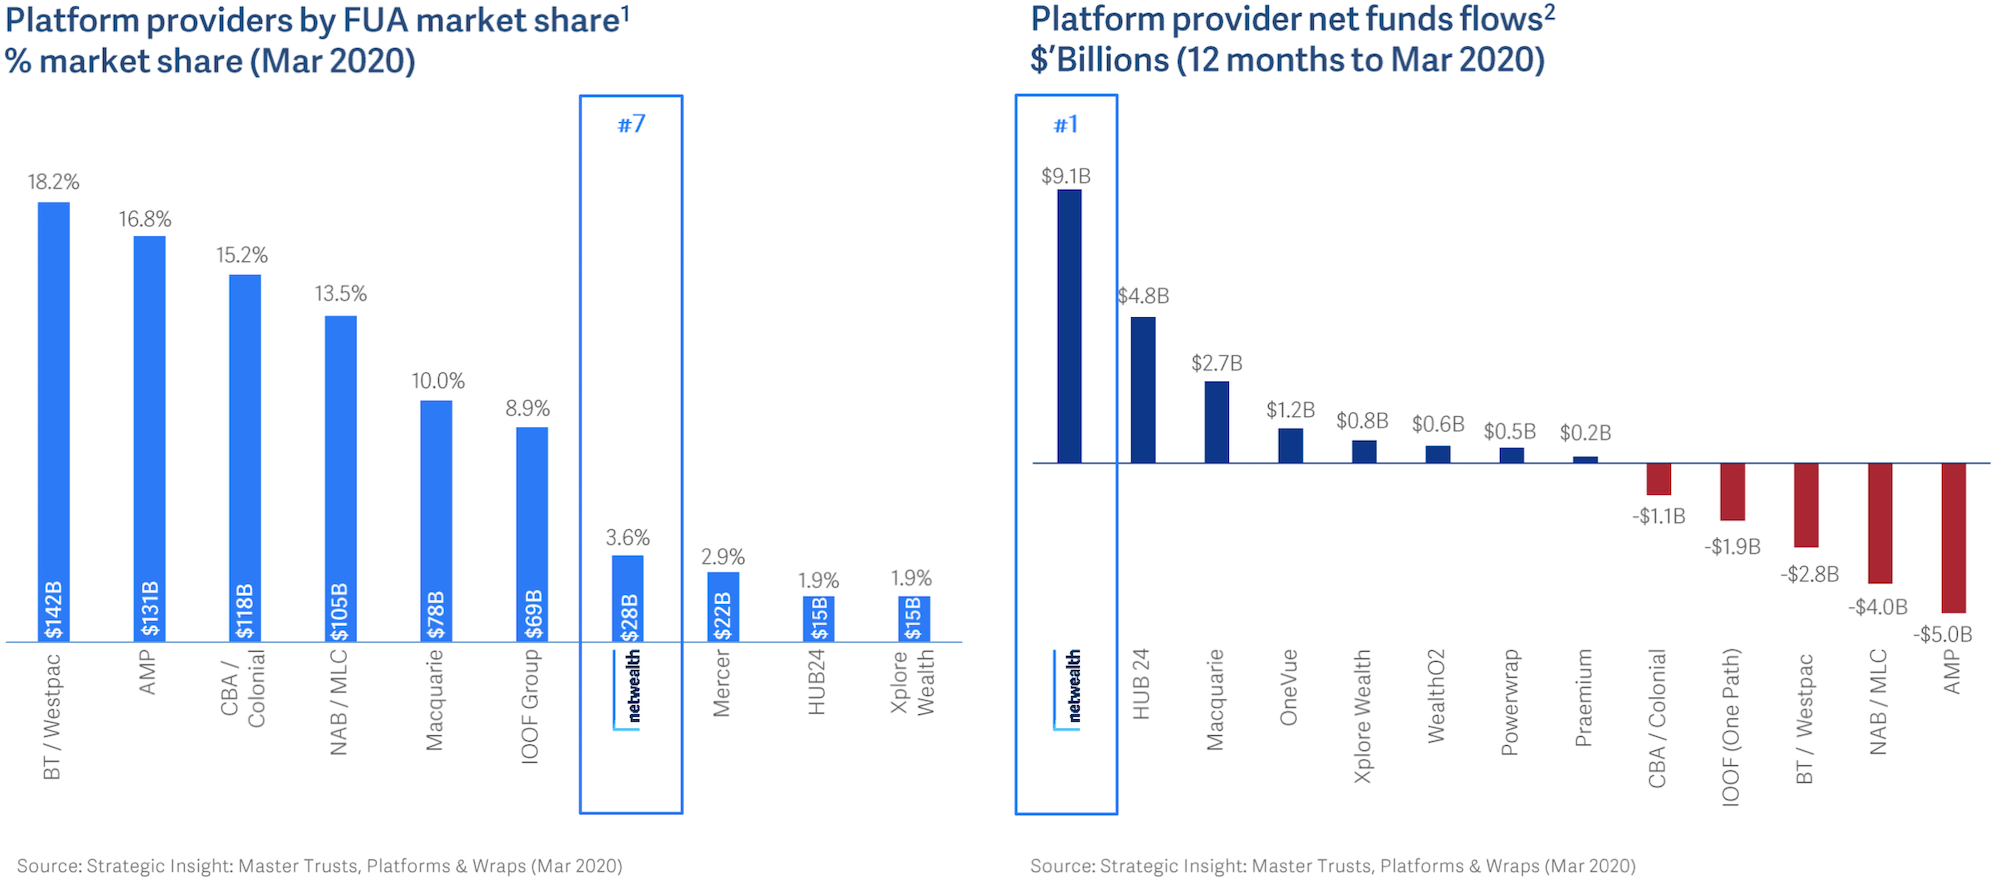
As previously announced, Netwealth importantly grew its market share from 2.5% in March 2019 to 3.6% at the end of March 2020.
As you can see in the chart below (on the right), the company continued to lead the industry in terms of net fund inflows, recording yearly inflows nearly double that of its nearest competitor, HUB24 Ltd (ASX: HUB). All the while the incumbents in the industry continued to lose ground.

Netwealth’s dividend
Despite primarily being a growth investment, Netwealth has been paying a dividend since 2018.
Today, the company declared a final dividend of 7.8 cents per share, fully franked. This is up 18% on FY19’s final dividend and takes full-year dividends to 14.7 cents per share.
With Netwealth shares currently changing hands at $14.19, this means shares are trading on a dividend yield of around 1%.
Now what?
Commenting on outlook, Netwealth said it expects to continue to benefit from industry tailwinds and remains positive about the future and continued market share growth.
Based on the company’s current pipeline, existing clients and growth in new clients currently transitioning onto the platform, Netwealth is forecasting FUA net inflows of approximately $8 billion in FY21 – notably lower than the $9.1 billion of inflows seen in FY20.
The shift towards independent specialist platform providers like Netwealth was accelerated by the banking royal commission and isn’t showing signs of stopping. Combined with a debt-free balance sheet and founder-led management team, I think there’s plenty to like about this business.
For another growth share I like the look of right now, check out the free 3,500-word investment report below.


