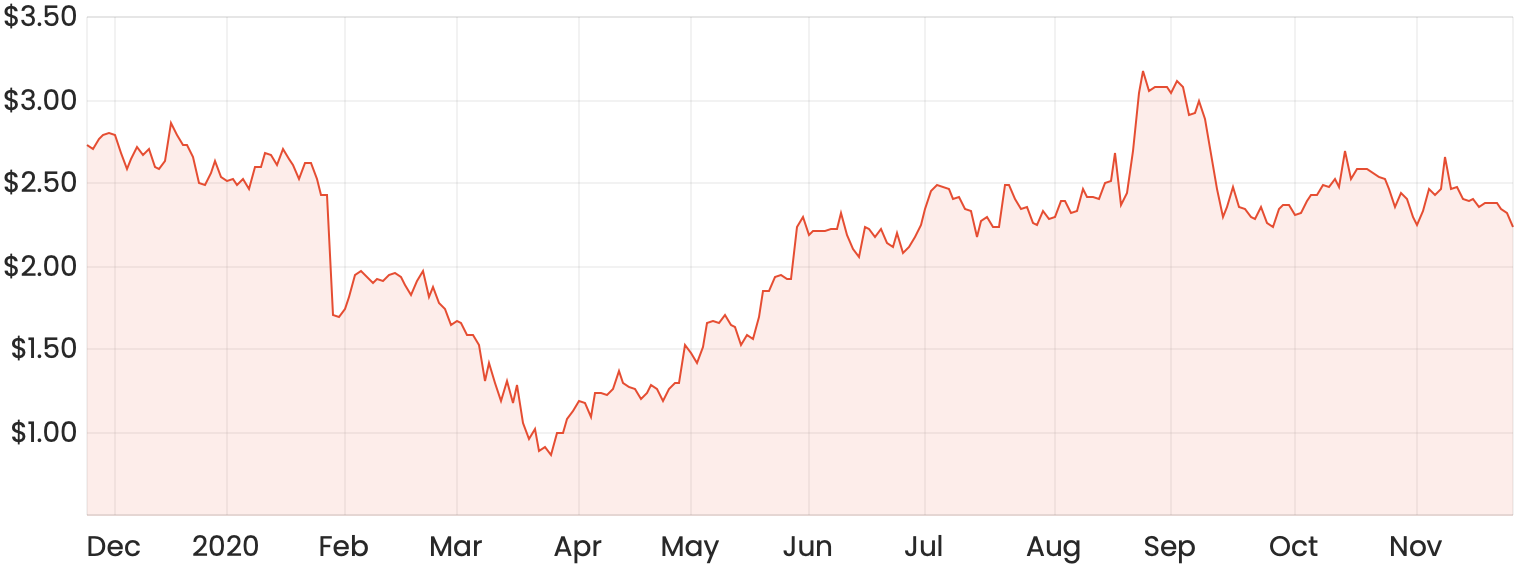
The Nearmap Ltd (ASX: NEA) share price has recovered strongly but is still down around 15% over the last 12 months. Nearmap recently held its annual general meeting (AGM), where the company touted high levels of estimated growth.
Could this be a buying opportunity?
NEA share price chart

About Nearmap
Nearmap was founded in 2007 in Australia and is now one of the world’s largest aerial surveying companies.
Nearmap operates a subscription Software as a Service (SaaS) business model using proprietary camera and software to capture aerial images via a fleet of aircraft in Australia, New Zealand, the United States and Canada.
Insights from Nearmap’s 2020 AGM
At Nearmap’s recent AGM, Chair Peter James said the company had a “milestone year” in FY20, exceeding $100 million in group ACV and climbing above 10,000 subscriptions. Nearmap’s average revenue per subscription also surpassed the $10,000 mark. ACV refers to the annualised value of all active subscription contracts in effect at a particular date.
During the year, Nearmap began offering artificial intelligence (AI) content to customers in the form of a premium subscription service. Peter stated he expects this to be “one of the cornerstones for the company’s future”.
He also reiterated that the recent $72 million capital raising and $23 million share purchase plan will accelerate growth opportunities.
CEO Dr Rob Newman outlaid the company’s opportunity to grow from FY21 onwards by establishing a leadership position in North America, growing its product offerings and entering new geographies.
Rob pointed out that ACV is the “best realtime measure of the growth of the company” and he expects this grow to between $120 million and $128 million in FY21.
In FY20, ACV lifted 18% on the prior year to $106.4 million. From 30 June 2018, ACV has grown at a compound annual growth rate of 27%.
Rob continued that Nearmap is currently focused on growing the top line (ACV) and reinvesting free cash flow from its Australian business to grow domestically and overseas.
He also re-iterated that Nearmap has a clear market opportunity to grow its share of the US roof geometry market, estimated to be worth US$100 to US$200 million a year. Nearmap entered this new market by acquiring roof geometry analytics business Pushpin in December 2019.
A key negative mentioned during the AGM presentation was that the customer churn rate had increased to 9.9% in FY20, up from 5.3% in the prior year. Nearmap targets a churn rate of less than 10%.
ASX-listed competitor making inroads?
Nearmap competitor, Aerometrex Ltd (ASX: AMX), announced in October 2020 that it had signed on Suncorp Group Ltd (ASX: SUN) and PSMA Australia to MetroMap, its aerial imagery subscription service.
In FY20, Aerometrex posted revenue of $20.1 million, up 24.7% on the prior year. Aerometrex has delivered a compound annual growth rate of 22.5% in revenue since FY16.
Valuation: Nearmap vs. Aerometrex
One way to assess if Nearmap shares offer value is the price/sales ratios (P/S). The ratio is calculated by dividing the market capitalisation of a company by its sales (revenue).
At the time of writing, Nearmap has a market capitalisation of $1.14 billion, implying that shares trade on a price to sales ratio of 11.8x. This looks to be quite pricey, but could be justified given Nearmap’s historical and projected growth rates.
However, Aerometrex has a current market capitalisation of $110 million and trades on a price to sales ratio of around 5.5x – roughly half that of Nearmap’s.
While Aerometrex is a smaller company, it is demonstrating strong growth and signing up large reputable businesses. If I had to invest in one of these companies right now, I would be leaning towards Aerometrex.


