The Deterra Royalties Ltd (ASX: DRR) share price is down about 11% since listing on the ASX on 23 October at $4.87. Is now a good time to load up the truck with shares?
Deterra Royalties is Australia’s largest mining royalty business. Deterra was formed via a demerger from leading mineral sands business Iluka Resources Ltd (ASX: ILU).
How does Deterra make money?
Deterra earns nearly all of its revenue from a royalty over iron ore mined from Mining Area C (MAC) operated by BHP Group Ltd (ASX: BHP). MAC is located within the Pilbara region of Western Australia, one of the world’s most iron-rich areas.
Royalties are defined by Deterra as: “contractual agreements that involve a one time up front payment or asset transfer in return for future payments, typically based on a percentage of revenue or profit from a specific project or set of tenement”.
Digging into the numbers, Deterra earns a payment equivalent to 1.232% of revenue (in AUD) derived from the MAC royalty area. In addition to this, Deterra also receives A$1 million for each incremental tonne in annual production above the prior highest annual production level.
Operations in the MAC have relatively low running costs, and are expected to have a mine life in excess of 30 years.
Deterra is not required to make any operating capital contributions to earn its royalties, and therefore the company has adopted a policy to pay 100% of net profit after tax as dividends.
In the year ending 31 December 2019, Deterra made a profit after tax of $54.5 million, with the group set to release its first financial half-year report on 24 February.
Deterra’s growth outlook
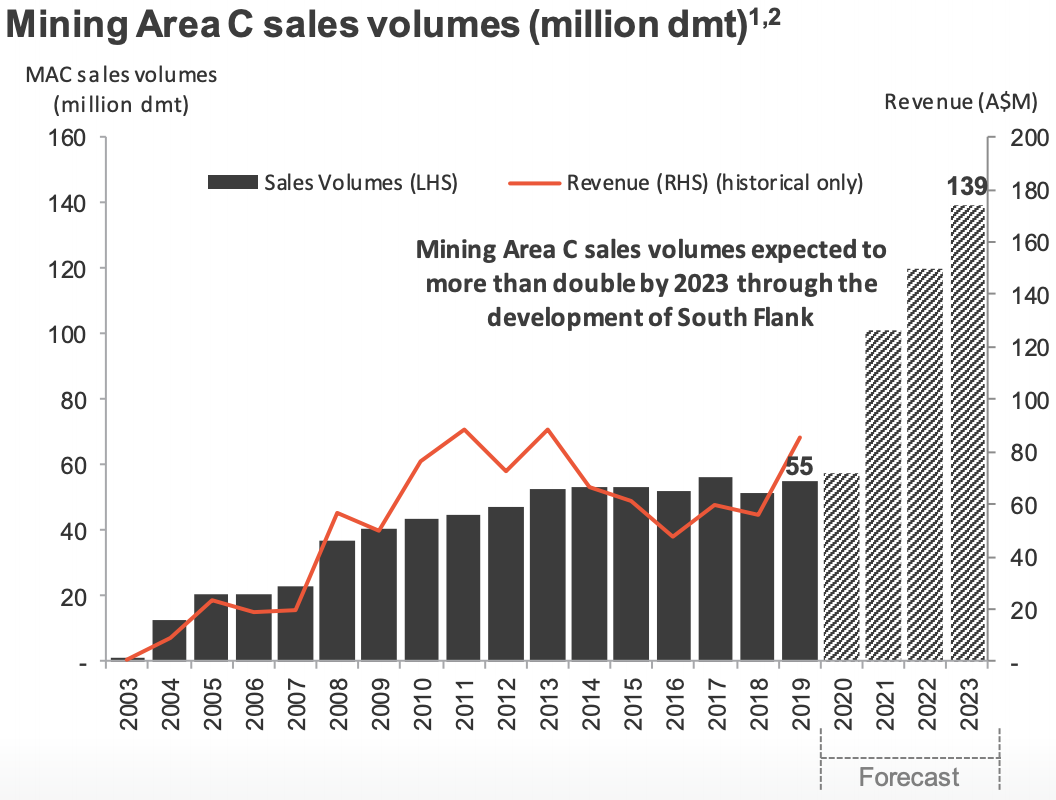
Deterra has guided that it expects to see significant growth in MAC iron ore production between 2021 and 2023 stemming from BHP’s South Flank expansion. When completed, MAC sales are projected to reach 139 million dry metric tonnes (Mdmt) as pictured below. This underscores a 144% rise from the current demonstrated annual capacity of 57Mdmt.
Deterra has mentioned it will also consider acquiring additional royalties if they are value accretive.

Risks
So far, Deterra’s business model sounds great, however, it does face risks.
Two of the biggest risks to Deterra’s future profits are negative fluctuations in the iron ore price and the AUD:USD exchange rate.
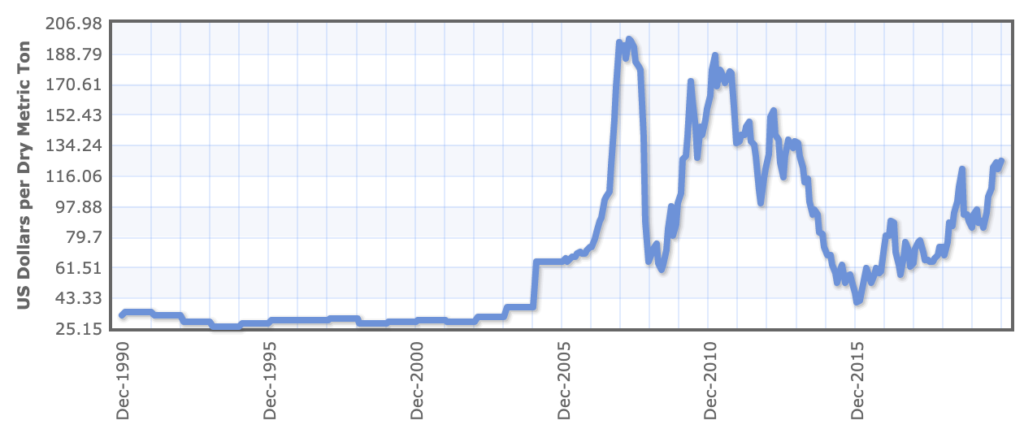
The below chart, sourced from Index Mundi, presents the 30-year price chart of iron ore in US Dollars per dry metric tonne. Clearly, the iron ore price has been extremely volatile, touching a low of US$26.47 in 1994 and a high of US$197.12 in 2008.
From a currency perspective, the AUD:USD exchange rate has been as low as 0.4829 and as high as 1.1054 over the last 30 years. Currently, the AUD: USD exchange rate is AU$1.00:US$0.76.

Are Deterra shares cheap?
One way to assess the value of Deterra shares could be to use the present value of an annuity formula. Valuation has been described as part art and part science, so this is simply my take.
To complete this calculation, we just need an estimated payment (dividend), interest rate (expected return), number of years (term) and payment frequency.
I will assume the payment is received for 30 years per the estimated life of the mine.
I have assumed payments are received annually for the sake of simplicity.
The interest rate represents the required return of the annuity. I will input 10% here as this is the minimum return I would require for an equity investment.
Calculating the payment (dividend) is the most tricky element given the volatility in the iron ore price and exchange rates.
I have estimated this payment by adjusting Deterra’s 2019 profit after tax by the expected increase in MAC iron ore volumes between 2019 and 2023.
According to Statista, the average iron ore price in 2019 was US$94 per dry metric tonne. As this is near the midpoint of iron ore prices over the past 30 years, this could be a reasonable forward estimate.
Between 2019 to 2023, MAC volumes are forecast to increase 152% from 55 Mdmt to 139 Mdmt. Increasing Deterra’s 2019 profit after tax of $54.5 million by 152% equals $137.3 million.
To convert these assumptions into a valuation, I used the Financial Mentor’s present value of an annuity calculator.
This resulted in a valuation of $1.29 billion. The current market capitalisation of Deterra is $2.29 billion – about 77% higher than my estimated value. This could imply that I am expecting too high a return from Deterra shares.
In summary, I would not invest in Deterra based on valuation grounds and the volatility of the iron ore price.
Instead of Deterra, I suggest getting a free Rask account and accessing our full stock reports. Click this link to join for free and access our analyst reports.


