The Vaneck Australian Equal Weight ETF
(ASX: MVW) and Vanguard Australian Shares Index ETF (ASX: VAS) are two of Australia’s top Australian shares ETFs. The VAS ETF and MVW ETF are very popular and similar, but they are also different. They are also different again to BetaShares A200 ETF (ASX: A200) and the SPDR S&P/ASX 200 ETF (ASX: STW).
MVW ETF Vs VAS ETF
The VanEck MVW ETF provides exposure to over 60 of the largest and most liquid Australian shares, equally weighted. By equally weighting shares, this ETF aims to reduce concentration risk in specific Australian stocks and sectors like banking and resources. For more information on the MVW ETF, see the Best ETFs Australia ASX MVW review.
The Vanguard VAS ETF provides exposure to the largest 300 Australian shares, weighted by market capitalisation. VAS is a low-cost way to access top Australian companies through a single investment/fund.
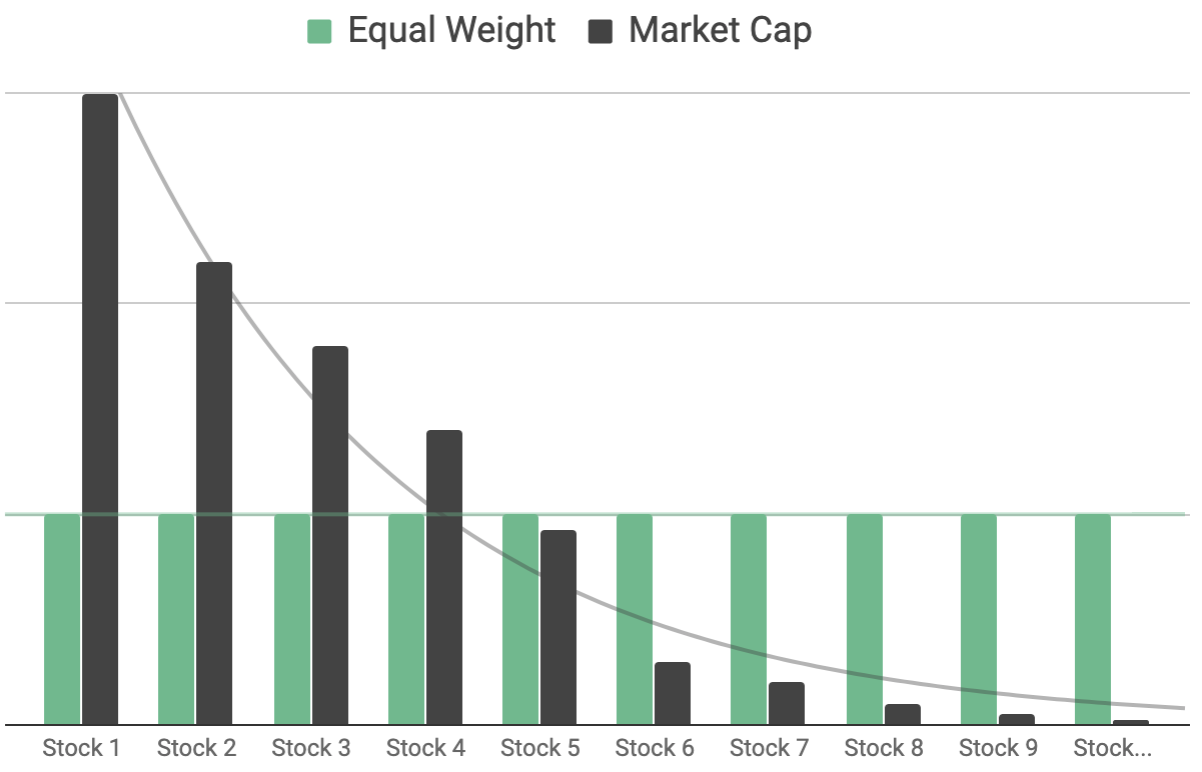
Equal Weight ETF V. Market Cap ETF

As you can see above, equal weighting and market cap weighting can result in two seemingly similar “share ETF portfolios” producing different outcomes.
The end result is the MVW ETF can sometimes hold smaller amounts of larger companies, such as Commonwealth Bank of Australia (ASX: CBA), compared to VAS. But VAS holds many of its 300 shares in smaller positions than MVW’s, say, 50th position. Inside VAS, the last 100 (out of the top 300) don’t account for that much of what’s inside the ETF.
In this video, from our Rask Education website and ETF investor course (free), I explain the difference between popular ETFs and how they can be very different depending on the ‘factors’ or ’tilts’ they follow. Never mind my moustache!
VAS Vs. MVW: show me the money
I’ll keep this comparison really basic and just study the fees and performance because you can visit the VAS ETF report page for more information.
Based on data until December 2020, the MVW ETF has a management expense ratio (MER) of 0.35% while the VAS ETF’s yearly fee was 0.10%. Therefore, VAS wins on fees. That said, a more useful metric to know is the fee quartiles that these ETFs find themselves in (note: quartile 1 is best). For example, any ETF which has a fee below 0.3% would be considered in our first (best) quartile.
Performance isn’t everything — and past performance is not often indicative of future performance — but on this measure, both ETFs have achieved my preferred three-year track record hurdle (meaning they have a track record for at least three years). As of December 2020, the MVW ETF had an average annual return of 7.21%. During the same time, the VAS ETF returned 8.24%.
Our takeaway
Again, my review today was very basic. So be sure to visit the free ASX MVW review or ASX VAS ETF review. That said, based on the Rask + Best ETF Australia proprietary ETF scoring formulas, the VAS ETF rates better against MVW, but not by much. They are both respectable ETFs for investors looking for basket exposure to Aussie shares.


