Recent ASX initial public offering GQG Partners Inc. (ASX: GQG) looks to be moving in on Magellan Financial Group Ltd’s (ASX: MFG) turf.
Both companies manage global equities portfolios for big institutions with funds under management (FUM) of $85.8 billion and $113.9 billion respectively.
It will be a battle for the ages. Rajiv
Jain vs. Hamish Douglass.
If you’re new to either business, check out the introductions to GQG and Magellan.
We’ll review each company against six factors: fees, risk, diversification, performance, valuation and management.
Get your popcorn and buckle in.
Round 1: Fees
Magellan has an average base management fee of 61.0 basis points.
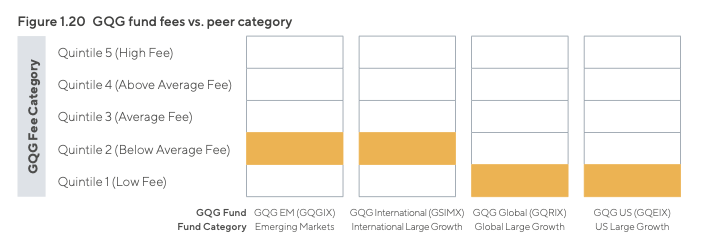
GQG average management fee is about 49.8 basis points.
To illustrate, if you invest $10,000 with both firms, you will pay $61.00 a year to Magellan and $49.80 to GQG.
It might not look like much of a difference, but GQG’s funds are 18% cheaper than Magellan.
Part of this is explained by the higher level of retail clients Magellan has, who are charged 135 basis points plus a 20% performance fee.
The other part is that GQG is simply better bang for your buck.

In fact, GQG ranks in the lowest quintile (bottom 20%) for fees against its peer group. Conversely, Magellan is at the opposite end.
“We believe that legacy firms, with relatively large, fixed overheads, may struggle to adjust pricing lower to compete with new entrants, giving us a competitive advantage” – GQG Propsectus
GQG takes round one. GQG – 1. Magellan – 0.
Round 2: Downside capture
Downside capture measures the average performance of a fund over time when the overall market falls.
For example, lets say the market is worth $100 and it falls 10%. Now the market is worth $90.
At the same time, the fund only falls by 5% to $95. Therefore, it would have a downside capture ratio of 50% (5%/10%).
However, if the fund fell by 20% to $80, its downside capture would be 200% (20%/10%).
The goal of downside capture is to keep it as low as possible. This eliminates volatility and infers a lower risk.
GQG has a downside capture of 77.3%. Put another way, GQG takes on about 23% less risk than the market.
Magellan’s downside capture is an impressive 45% or less than half the risk of the market.
Notably, Magellan has been through two market downturns (global financial crisis in 2008 and the pandemic in 2020), demonstrating the resiliency of the portfolio.
Magellan strikes back. GQG – 1. Magellan – 1.
Round 3: Diversification
Diversification – in this case – means how many different products and adjacent services each company sells.
Higher diversification is a positive because if one product is underperforming, it can be offset by other parts of the business.
GQG in some way is a lot like Magellan in its early days. A low number of strategies outperforming the market.
Currently, GQG has four main strategies across global equities, with an additional three dividend-focused funds recently released.
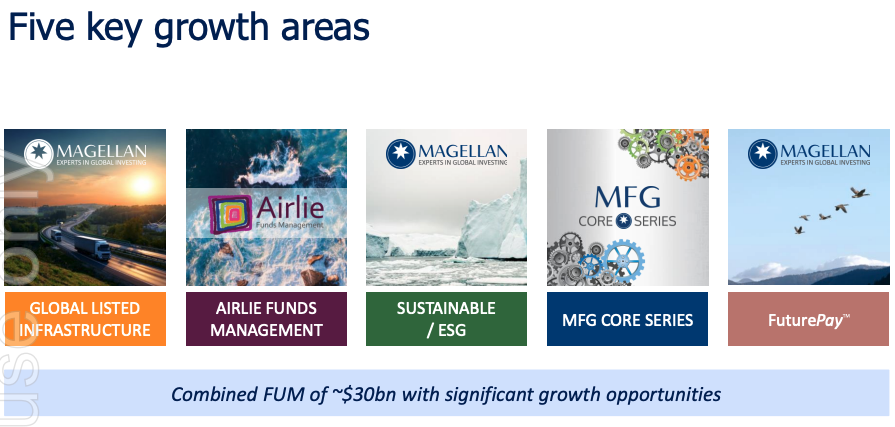
Given Magellan is 10 years older, it’s had time to branch out into other products including exchange-traded funds, retirement and private equity investments.

The business also has its infrastructure fund and high conviction funds.
Magellan gets the point largely because it’s been around the block longer and had more time to broaden its product range.
GQG – 1. Magellan – 2.
Round 4: Performance
As at 30 June 2021:
- GQG Global Equity Fund has had a 16.88% per annum return since its inception in June 2016, outperforming the benchmark by 2.66%
- Over the same period, the Magellan Global Fund has a 14.4% per annum return, underperforming its index by 0.2%.
In summary, GQG has outperformed both Magellan its index.
However, it’s worth nothing Magellan has an additional eight-year of track record.
GQG gets the points. GQG – 2. Magellan – 2.
Round 5: Valuation
Magellan is currently trading on a price-to-earnings ratio of 15.
GQG is trading a price-to-earnings ratio of 23.
At face value, Magellan looks cheaper. But it’s worth noting GQG expects to grow funds under management in FY22 by 9% whereas Magellan experienced net outflows in its latest quarterly update.
Also as discovered in fees, Magellan is at the more expensive end of the spectrum.
Fees may come under pressure and in anticipation, the market is ascribing a lower multiple.
I’d argue Magellan offers high upside at today’s prices, but also higher risk. It’s a matter of personal choice. As a result, no points allocated for Round 5.
Scores remain even. GQG – 2. Magellan – 2.
Round 6: Management & Ownership
Jain owns 68% of GQG. Douglass owns about 12% of Magellan although has never sold a share.
Both have established management teams. GQG CEO Tim Carver has been at the helm since 2016 and has ten years prior experience as the head of Pacific Current Group Ltd (ASX: PAC).
Magellan’s team is equally solid. Head of Research Vihari Ross, Infrastructure lead Gerald Stack and Deputy CIO Domenico Giuliano all started in 2007.
It’s tough to split. Endurance isn’t necessarily a sign of quality. But in this instance, Magellan’s track record pips GQG ever so slightly.
GQG – 2. Magellan – 3.
My take
The scoring was a bit of fun. But the main takeaway is that both Magellan and GQG have different strengths.
Ultimately, it really comes down to your view of each company.
Can Magellan turn around performance and use diversification to grow the business?
Or will GQG’s industry-low fees and superior returns put a rocket under its funds and subsequent share price?


