Having been in a downward trend since the rise of inflation in 2021 a recent bout of unsupportive data has seen the Australian dollar (AUD) fall to an 11-month low.
Considering a ‘risk on’ currency, the Australian dollar’s key drivers have historically been interest rate differentials, global economic growth and the associated demand for commodities in which Australia is a large exporter.
However, the past two years have been marked by slowing economic growth, with fears of conditions worsening, and relative strength for the ‘safe haven’ US dollar.
Broad US dollar strength has come on the back of higher US real yields. Inflation continues to subside in the US at a greater pace than Australia.
The interest rate differential between the two countries has also widened from 0% to 1.40% over the past 18 months. These factors make holding and earning interest on US dollars and debt relatively more appealing. Investors also look to the US dollar as an alternative to riskier assets, like equities, during periods of market volatility.
China’s sluggish re-opening, disappointing policy response, and re-emergence of credit stress in the property and shadow banking sectors is also impacting the Australian dollar.
China accounts for 70% of global shipments of iron ore and the slowing pace of their economy has stoked concerns about demand for both Australia’s mining and energy export industries.
Given this weakness in the AUD – how should investors think about their currency exposure?
How currency movements affect returns
In most cases, a decrease in the value of the Australian dollar leads to an increase in returns of overseas assets, when converting returns back into Australian dollars. For instance, if the Australian dollar were to decline by 10% relative to the US dollar, the value of investments denominated in US dollars would typically increase by 10% in Australian dollar terms, all else being equal.
For example, from the peak AUD/USD exchange rate in February 2021 of US80c to the current level of around US65c, currency movements would have contributed approximately 23% to an Australian’s US denominated investments.
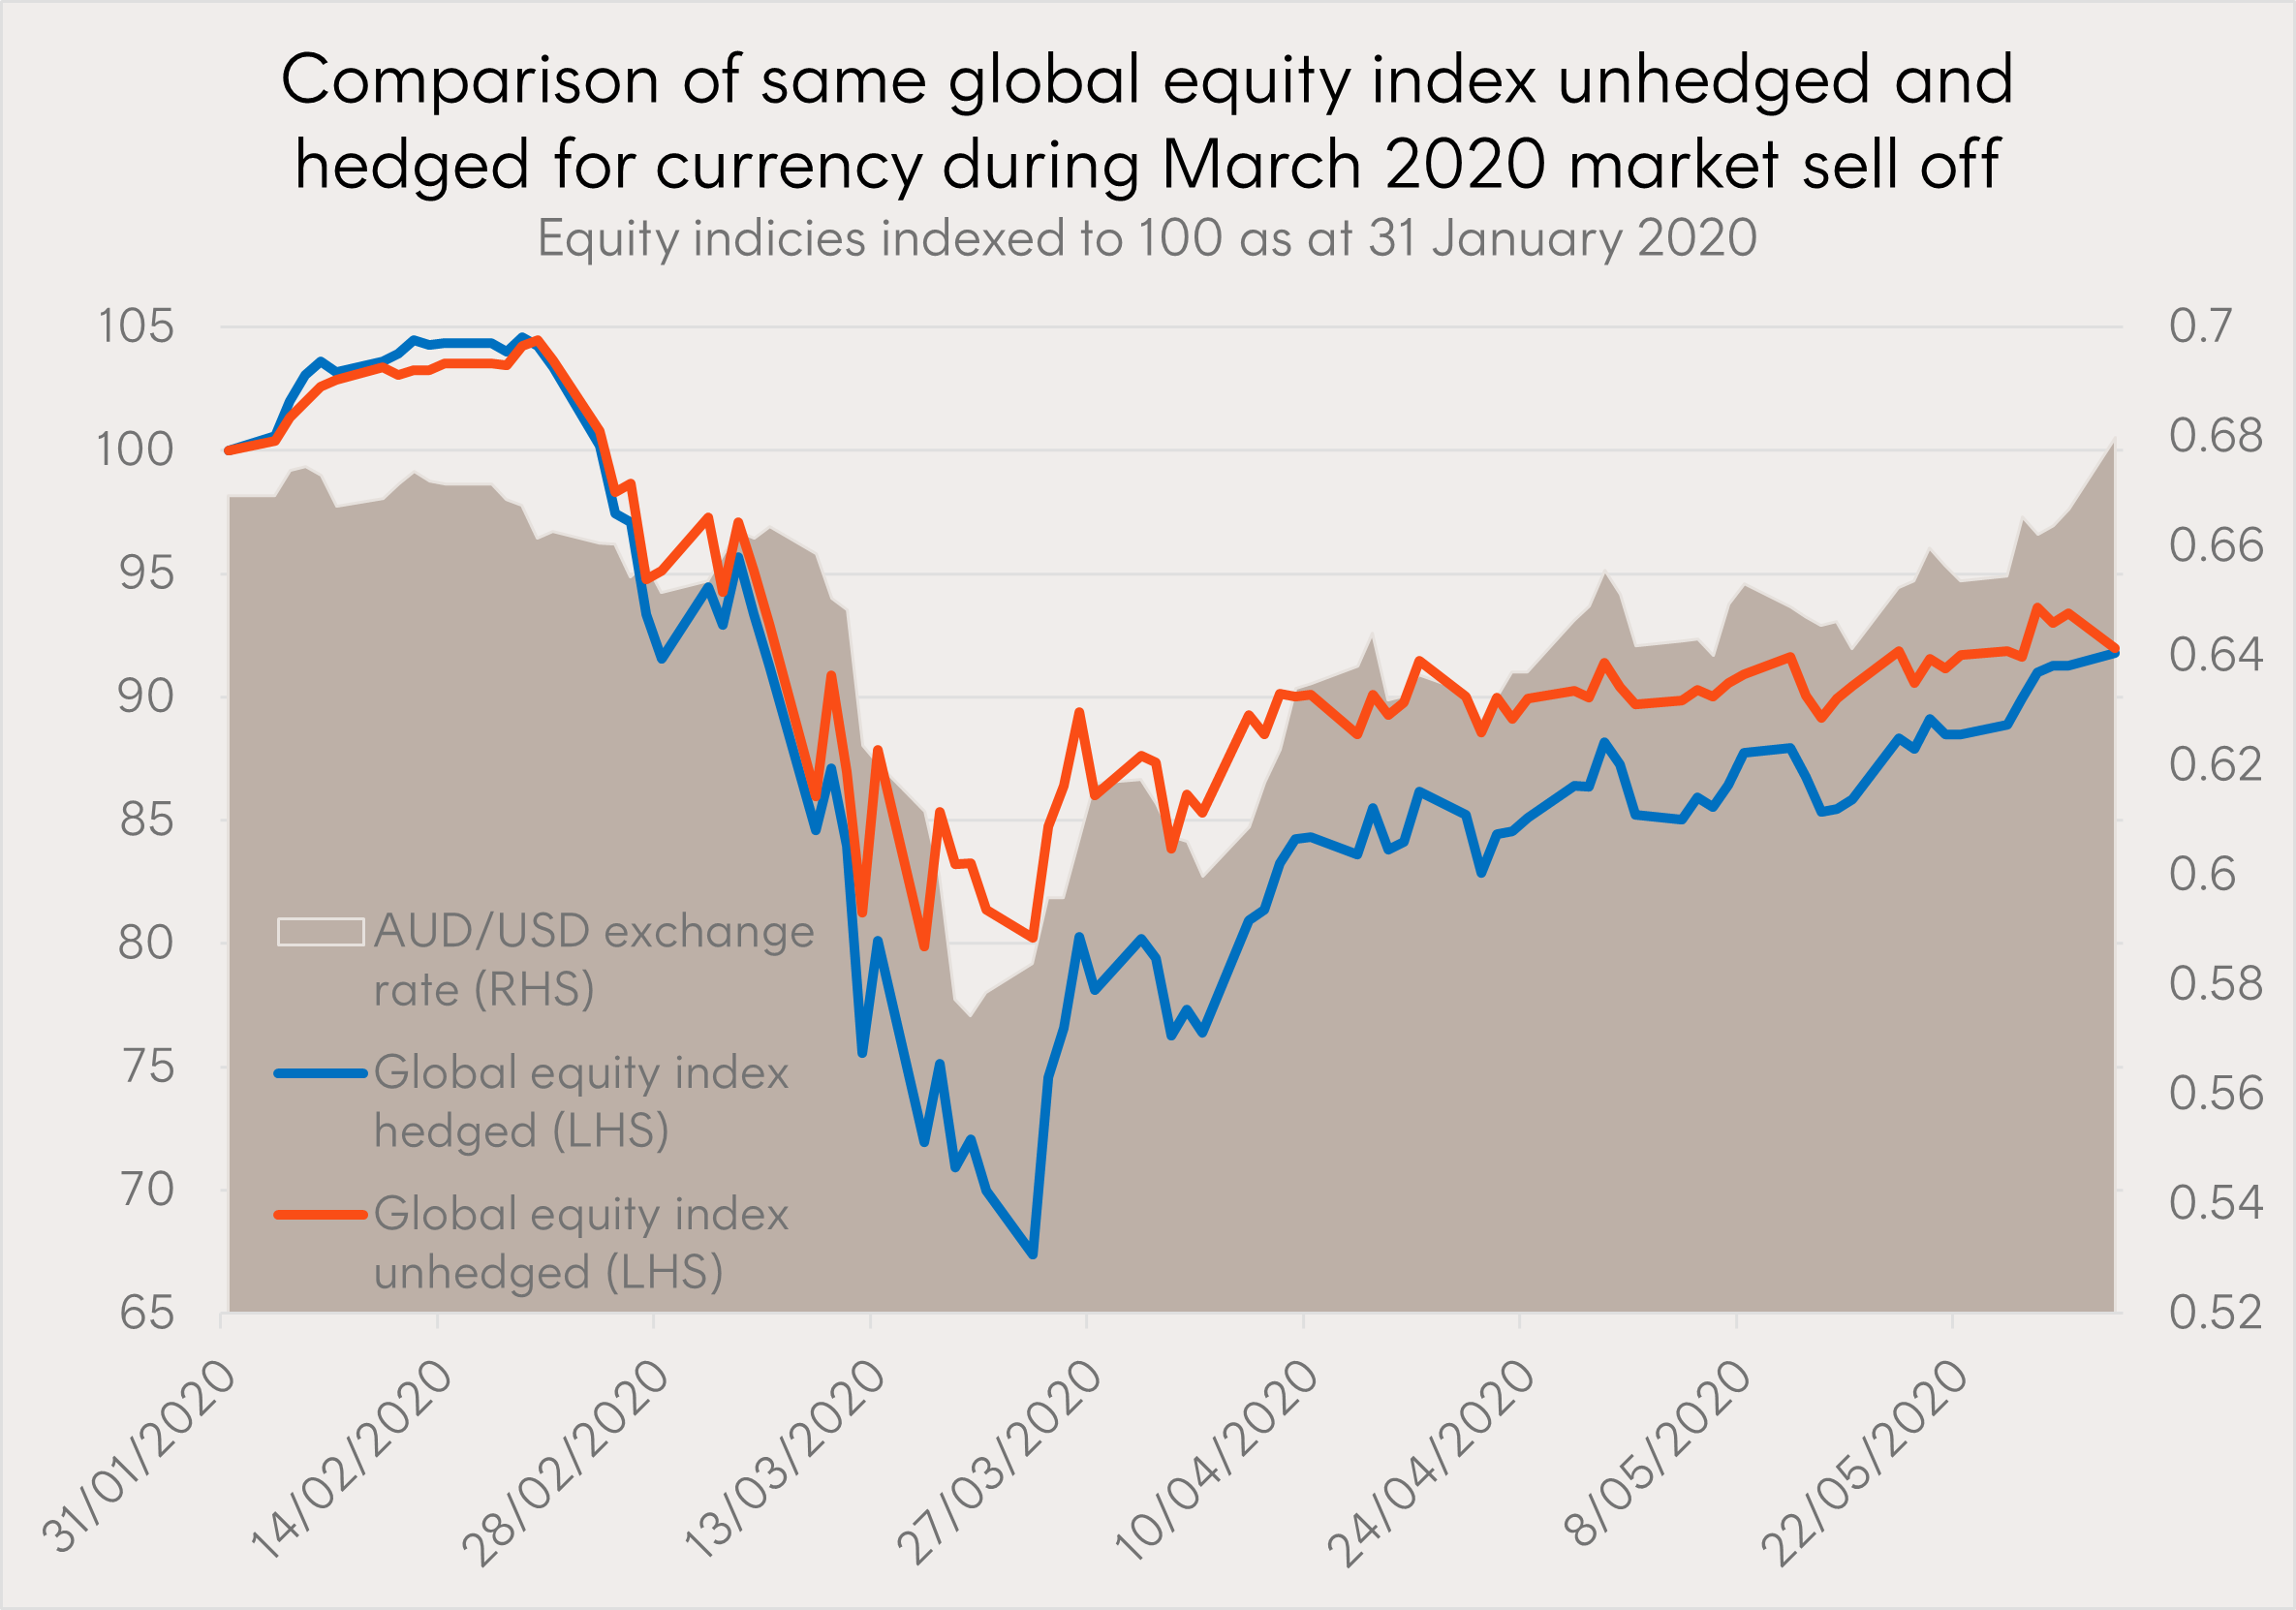
The Australian currency’s tendency to depreciate relative to the US dollar in risk-off environments can create a buffer during market downturns for Australian investors. During the first half of 2020, markets sold off heavily due to fear around the emergence of COVID. This sell-off coincided with the Australian dollar falling from US67c to US58c before recovering to the same level two months later.
In the chart below, we compare the performance of an unhedged global equities index to the same index that is hedged for currency movements. The result in returns for the two exposure is the same as the AUD/USD exchange rate returned to the same level over the period shown (31 January 2020 to 1 June 2020).
However, the return buffer from the falling Australian dollar on the unhedged index meant it experienced a lower drawdown – 20% compared to 33% – with lower volatility.

Source: Bloomberg. 31 January 2020 to 1 June 2020. Global equity index hedged represented by Solactive GBS Developed Markets ex Australia Large & Mid Cap Index AUD Hedged. Global equity index unhedged represented by Solactive GBS Developed Markets ex Australia Large & Mid Cap Index. You cannot invest directly in an index. Index returns do not take into account fund management fees and costs. Past performance is not an indication of future performance.
What options do investors have to currency hedge portfolios?
Currency hedged ETFs seek to substantially offset a fund’s exposure to movements in the value of foreign currency.
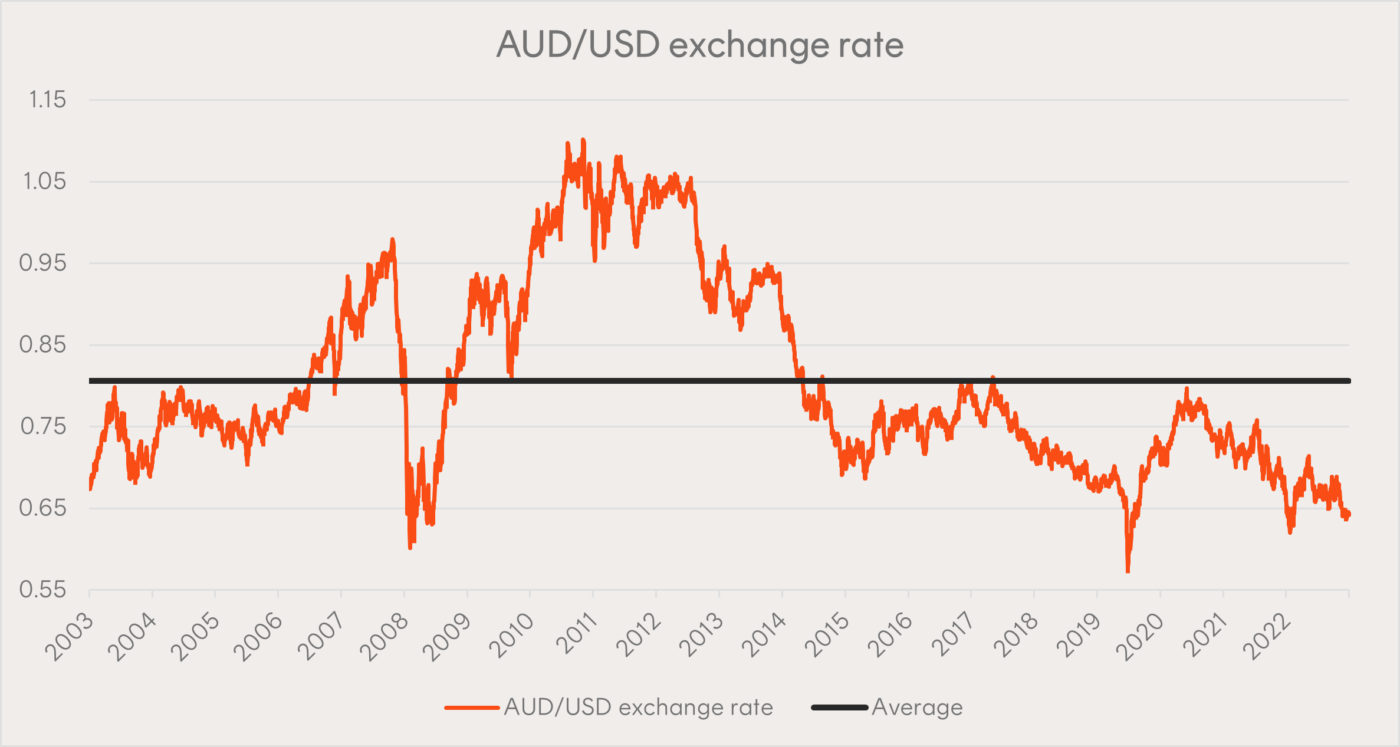
Historically, we have observed US65c being a key level for investors considering whether to start investing into currency hedged ETFs. The Australian dollar recently fell below this mark for just the fifth time in the past 20 years. The long-term average exchange rate has been around US81c, as shown in the chart below.
If the Australian dollar mean reverted to this level from US65c, investors in unhedged US dollar exposures would suffer approximately 20% in losses due to currency returns.

Source: Bloomberg. 22 September 2003 to 22 September 2023. Average is the average over the period. Past performance is not an indicator of future performance.

