
Candlestick charts, also known as K-Line charts, are a commonly used form of charting in financial market technical analysis.
They visually represent the price movement over a specific period of time using candlestick shapes, including information such as the opening price, highest price, lowest price, and closing price.
Candlestick charts help investors gain a more intuitive understanding of market conditions, price trends, and aid in making investment decisions.
In simple terms, candlestick charts are graphical representations of share price movements that allow us to analyze past trends and predict future price movements.
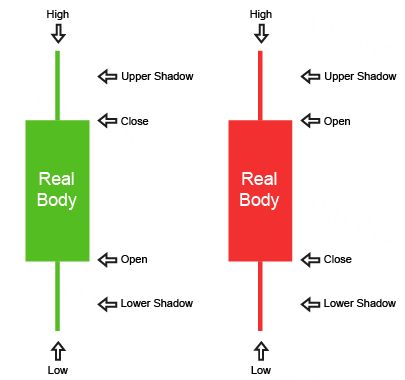
A candlestick chart consists of two parts: the body and the wick. The body represents the price range between the opening and closing prices and is usually depicted in red or green.
A red body indicates that the closing price was lower than the opening price, representing a price decline, while a green body indicates that the closing price was higher than the opening price, representing a price increase. The wick represents the price range between the highest and lowest prices.
Candlestick charts use different patterns and combinations to convey various price movements and market sentiments, assisting investors in technical analysis.
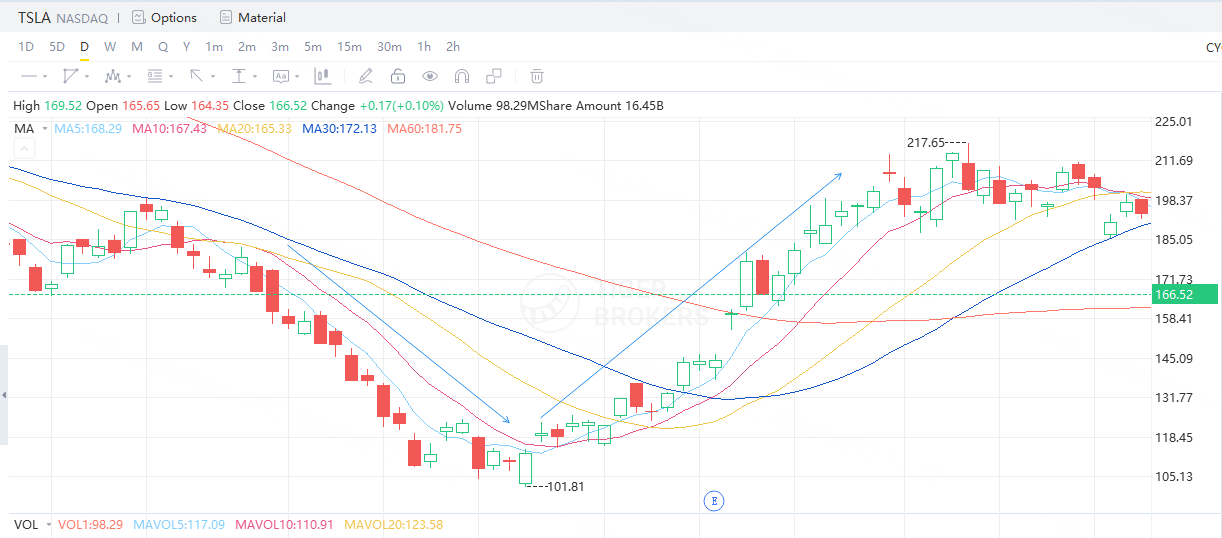
Here’s an example:
When multiple consecutive red bodies appear, and the bodies are relatively long, it suggests that the market may be in a downtrend. Conversely, when multiple consecutive green bodies appear, and the bodies are relatively long, it suggests that the market may be in an uptrend.
In terms of investment strategies, when utilizing candlestick charts for technical analysis, various candlestick strategies can be combined to make investment decisions.
Here are a few simple and understandable candlestick strategy examples:
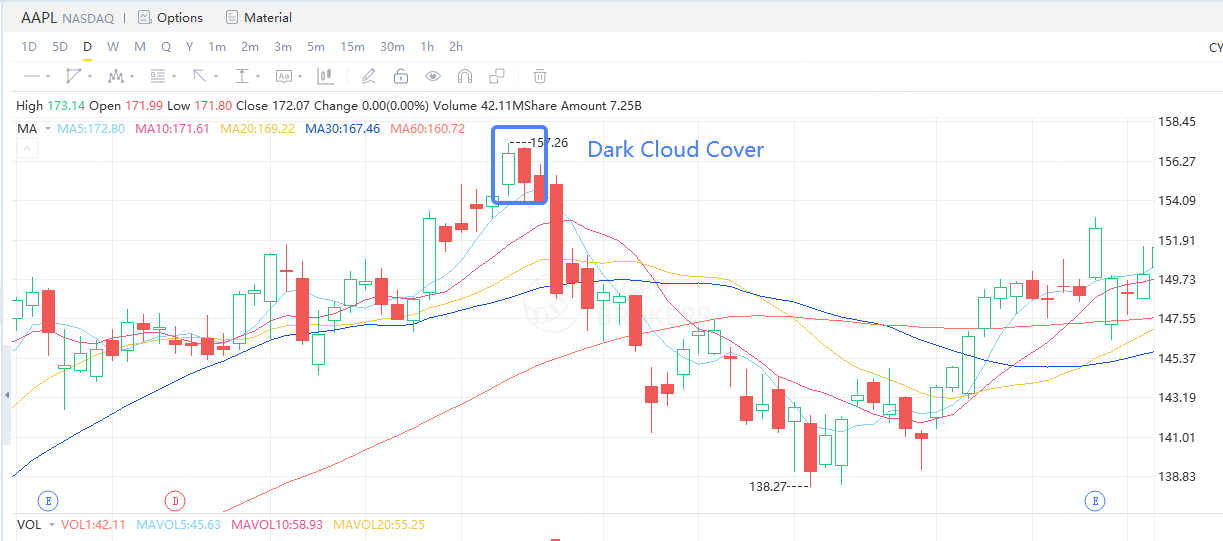
- Dark Cloud Cover: Dark Cloud Cover is a bearish candlestick pattern that typically occurs in an upward price trend.
It consists of two consecutive candlesticks: the first one is a long bullish candlestick, and the second one is a long bearish candlestick. The bearish candlestick’s body covers at least half of the bullish candlestick’s body, and the bearish candlestick’s closing price is below the bullish candlestick’s opening price.
This pattern may suggest a potential price decline, and investors may consider selling stocks or setting stop-loss orders.
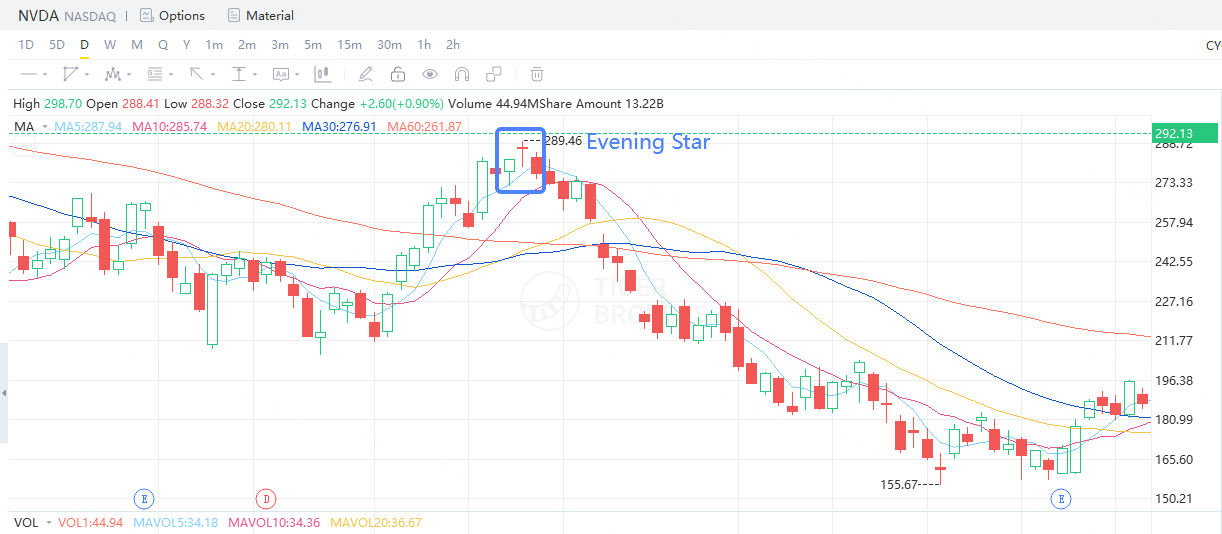
- Evening Star: Evening Star is a bearish candlestick pattern that typically occurs in an upward price trend.
It consists of three consecutive candlesticks: the first one is a long bullish candlestick, the second one is a short-bodied candlestick, and the third one is a long bearish candlestick. The bearish candlestick’s closing price is below the body of the first bullish candlestick.
This pattern may indicate a potential price decline, and investors may consider selling shares or setting stop-loss orders.
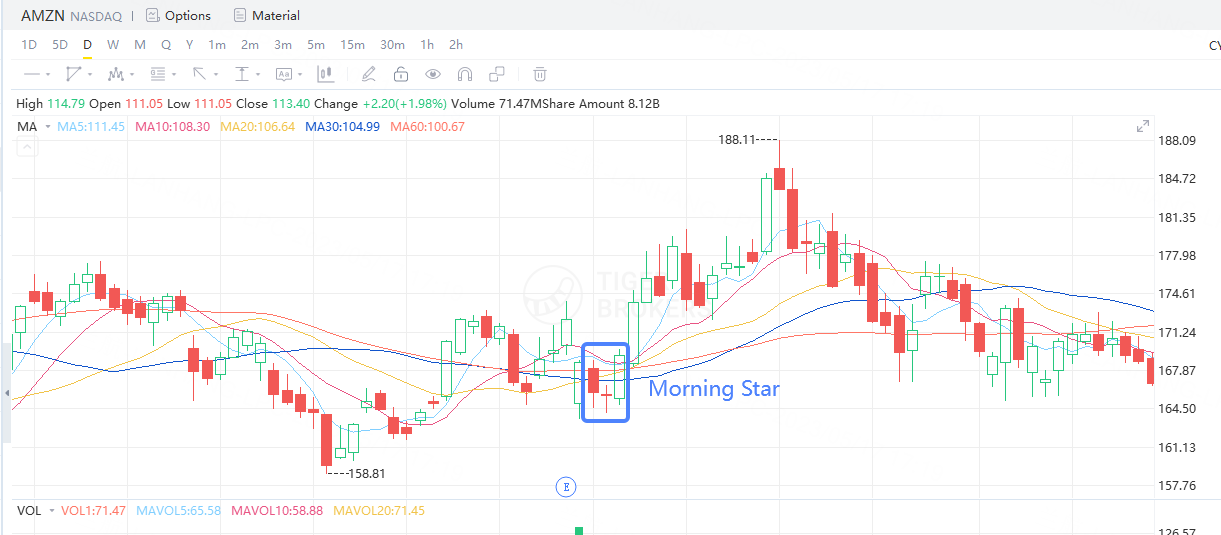
- Morning Star: Morning Star is a bullish candlestick pattern that typically occurs in a downward price trend.
It consists of three consecutive candlesticks: the first one is a long bearish or bullish candlestick, the second one is a short-bodied candlestick, and the third one is a long bullish candlestick. The bullish candlestick’s closing price is higher than the body of the first bearish or bullish candlestick.
This pattern may suggest a potential price increase, and investors may consider buying stocks or setting buy signals.
It is important to note that these are just simple examples of candlestick strategies. When using candlestick charts for technical analysis, it is essential to consider multiple factors, including market trends, share fundamentals, trading volume, and exercise caution in real-world operations to make wise investment decisions.