
The Moving Average (MA) is a commonly used technical analysis indicator to analyze the trend and movement of asset prices. It is a smoothed line calculated based on historical price data, helping investors better understand the price trends of assets and make investment decisions.
In simple terms, the Moving Average is a technical analysis tool that assists investors in determining investment trends.
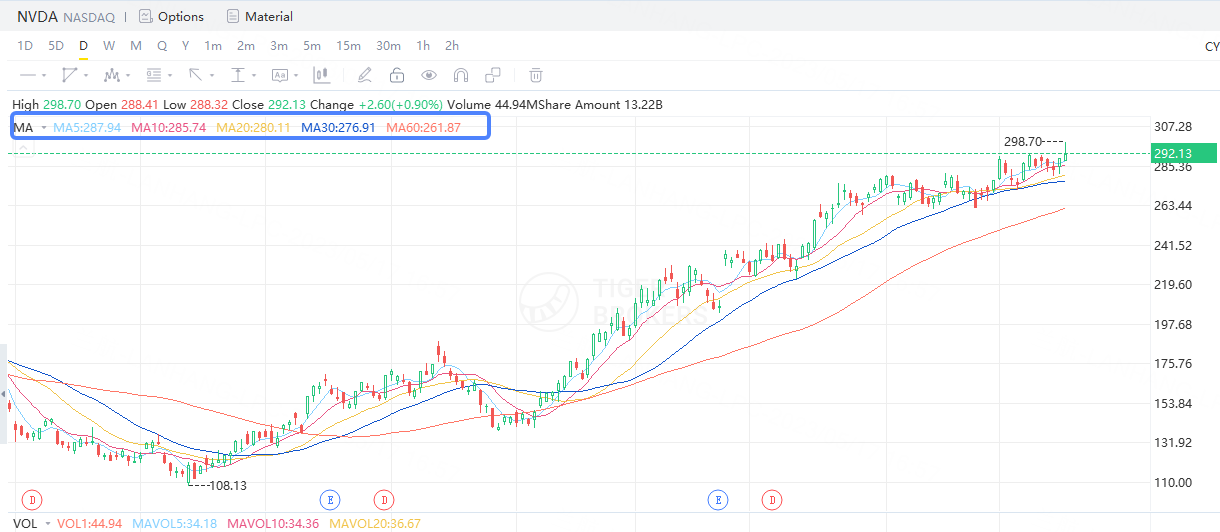
The Moving Average smooths price data by calculating the average price over a specific period of time, enabling better observation of price trends. Common types of moving averages include the 5-day moving average, 10-day moving average, 20-day moving average, and 60-day moving average.
The Moving Average is calculated by summing the price data over a period of time and then dividing it by the length of the time period, resulting in an average value.
For example, a 20-day moving average is obtained by summing the prices of the past 20 trading days and dividing it by 20 to calculate the average value. The Moving Average assigns equal weight to each price data point, making price movements smoother for longer time periods.
The Moving Average can be used to determine price trends. For instance, by observing whether prices are above or below the moving average, one can assess whether there is an upward or downward trend.
Additionally, the Moving Average can be employed to identify crossover signals. For example, when a short-term moving average crosses above a long-term moving average, it may generate a buy signal, while the opposite may generate a sell signal.
Here’s an example:
Suppose you are considering purchasing a share, and you can use the Moving Average to observe the price trend of that share. If the share price is above the 20-day moving average and the 20-day moving average is trending upward, it might indicate an upward price trend and serve as a potential buy signal.
However, investors should exercise caution when using the Moving Average, considering other technical indicators, fundamental analysis, market conditions, and personal investment goals to make comprehensive investment decisions.
When using the Moving Average for share trading, different strategies can be employed to make investment decisions. Here are a few simple examples:
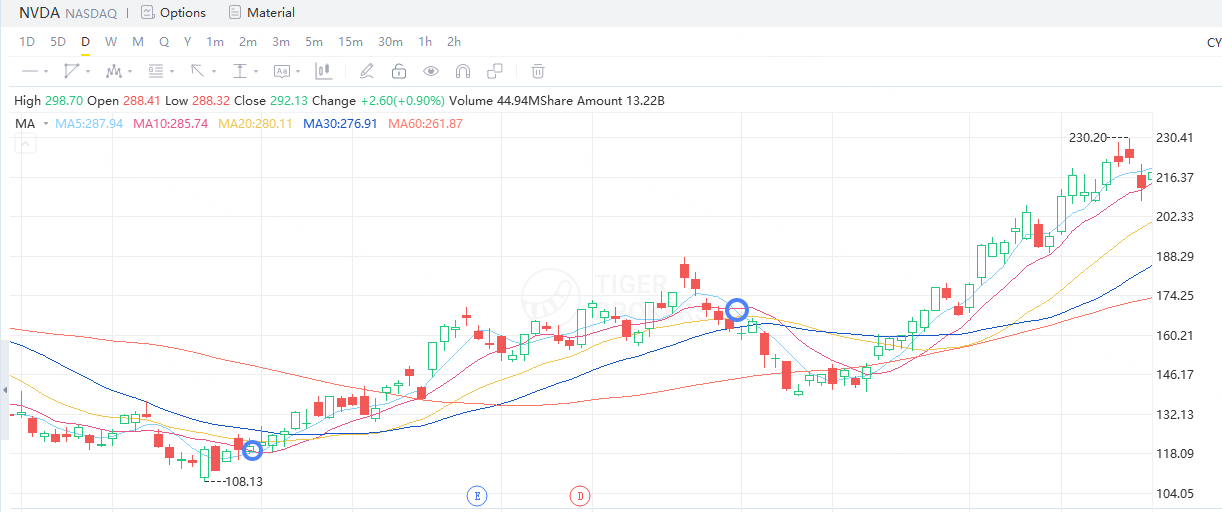
1.Golden Cross and Death Cross Strategy: A golden cross occurs when a short-term moving average crosses above a long-term moving average, while a death cross occurs when a short-term moving average crosses below a long-term moving average.
You can make buy or sell decisions based on these crossover signals. For instance, when a short-term moving average (e.g., 10-day MA) crosses above a long-term moving average (e.g., 20-day MA), generating a golden cross signal, it may indicate a buying opportunity.
Conversely, when a short-term moving average (e.g., 10-day MA) crosses below a long-term moving average (e.g., 20-day MA), producing a death cross signal, it may suggest a selling opportunity.
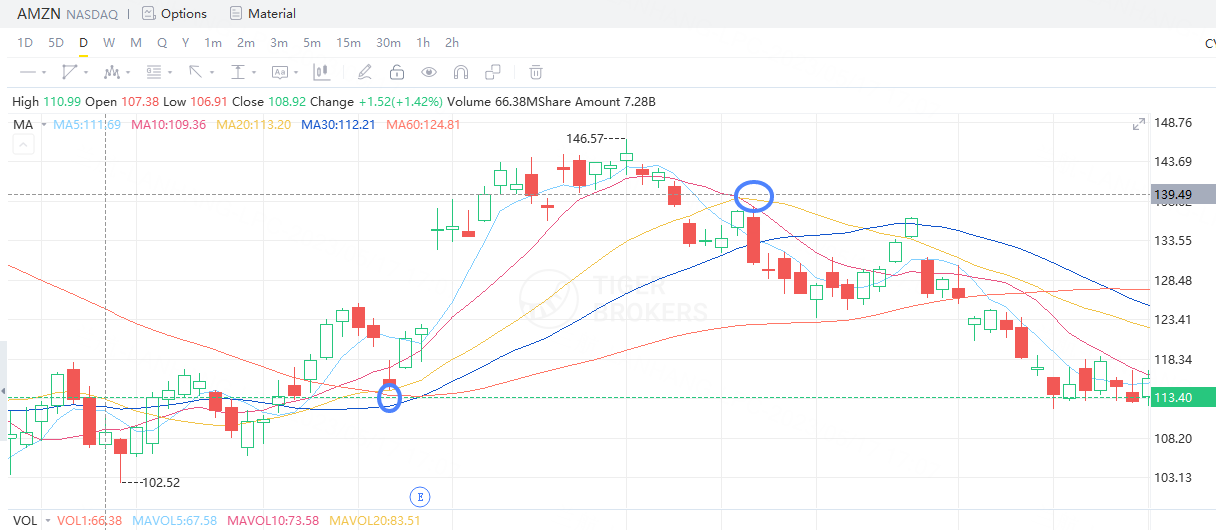
2.Support and Resistance Strategy: You can use the Moving Average as support and resistance levels to aid in determining buy and sell opportunities.
For example, when the stock price approaches or crosses above the Moving Average and finds support, investors may consider buying.
Conversely, when the stock price approaches or crosses below the Moving Average and encounters resistance, investors may consider selling. This strategy can be combined with other technical indicators and price patterns to confirm buy and sell signals.
It is important to note that the above examples are merely illustrative. When using the Moving Average for share trading, you should consider other factors such as market trends, share fundamentals, risk management, and exercise caution in practical operations to make sound investment decisions.