With inflation falling and the bulk of interest rate hikes apparently behind us, the economy increasingly looks to be headed for that elusive ‘soft landing’. With this backdrop, many opportunities and risks no doubt await investors.
And what better way than charts to keep abreast of these opportunities and risks?
We asked six Betashares investment experts to nominate a chart that they think investors should be watching in the year ahead.
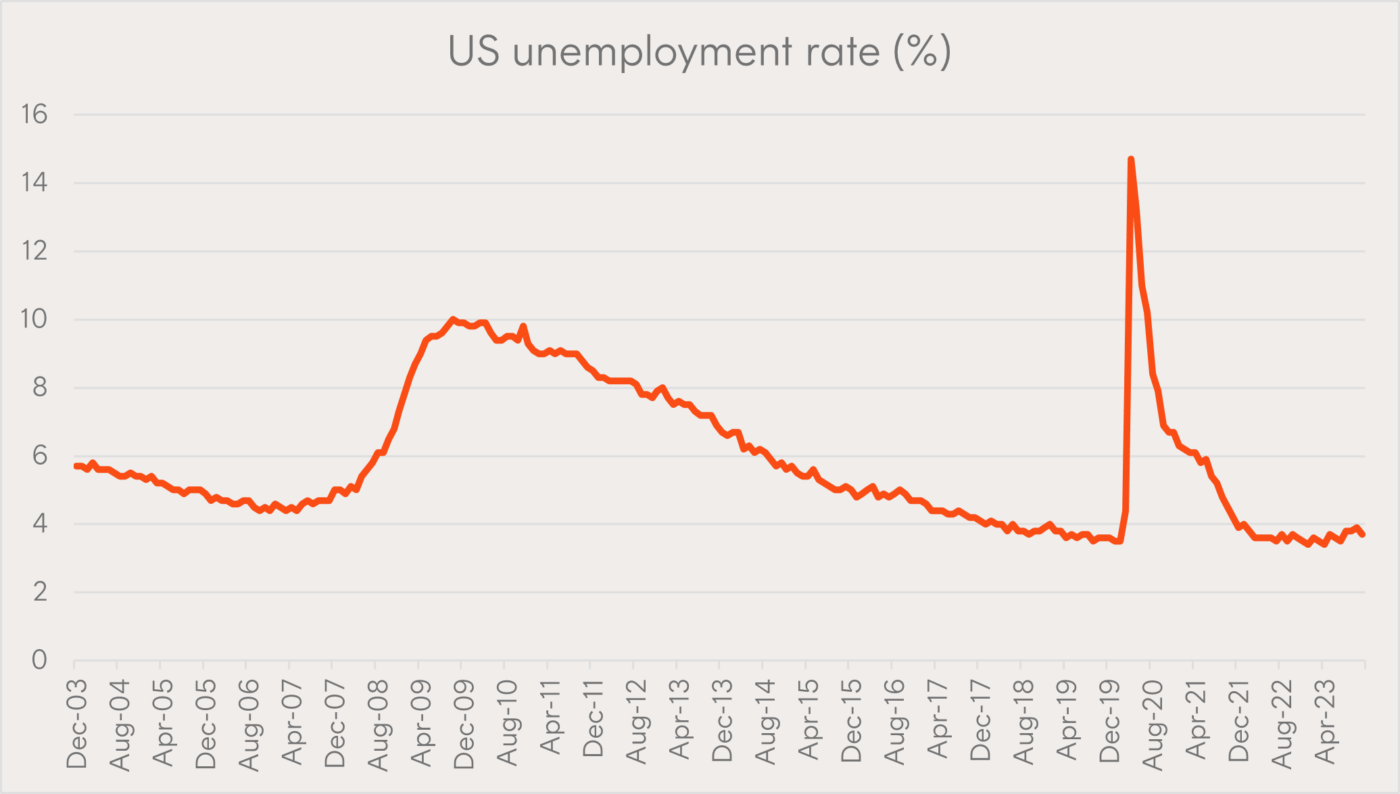
No red flags from unemployment rate yet
Nominated by: David Bassanese, Chief Economist.
Why it’s important
US unemployment effectively indicates whether the world’s largest economy is likely to go into or avoid a recession.
Historically, the US economy has tipped into recession whenever the unemployment rate has lifted by more than 0.5% for a sustained period of three months or more.
Despite aggressive US interest rate increases in the past year, the unemployment rate has so far drifted up only marginally and remains remarkably low.
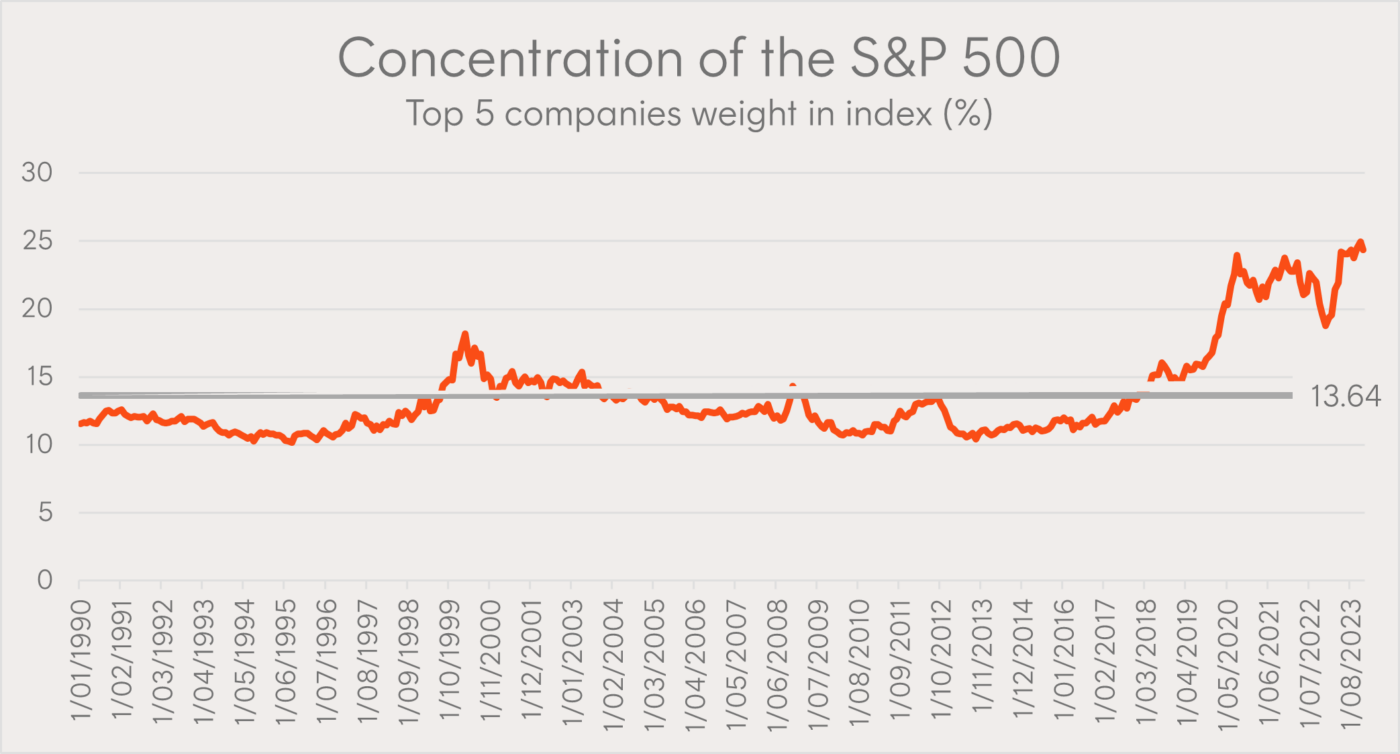
Concentration is at historic levels: Could it mean-revert?
Nominated by: Louis Crous, Chief Investment Officer.
Why it’s important
The S&P 500 (INDEXSP: .INX) Index is the most concentrated it’s been since the early 70’s*. Historically, high levels of concentration have tended to mean-revert, which is positive for relative performance of the equal weight index.
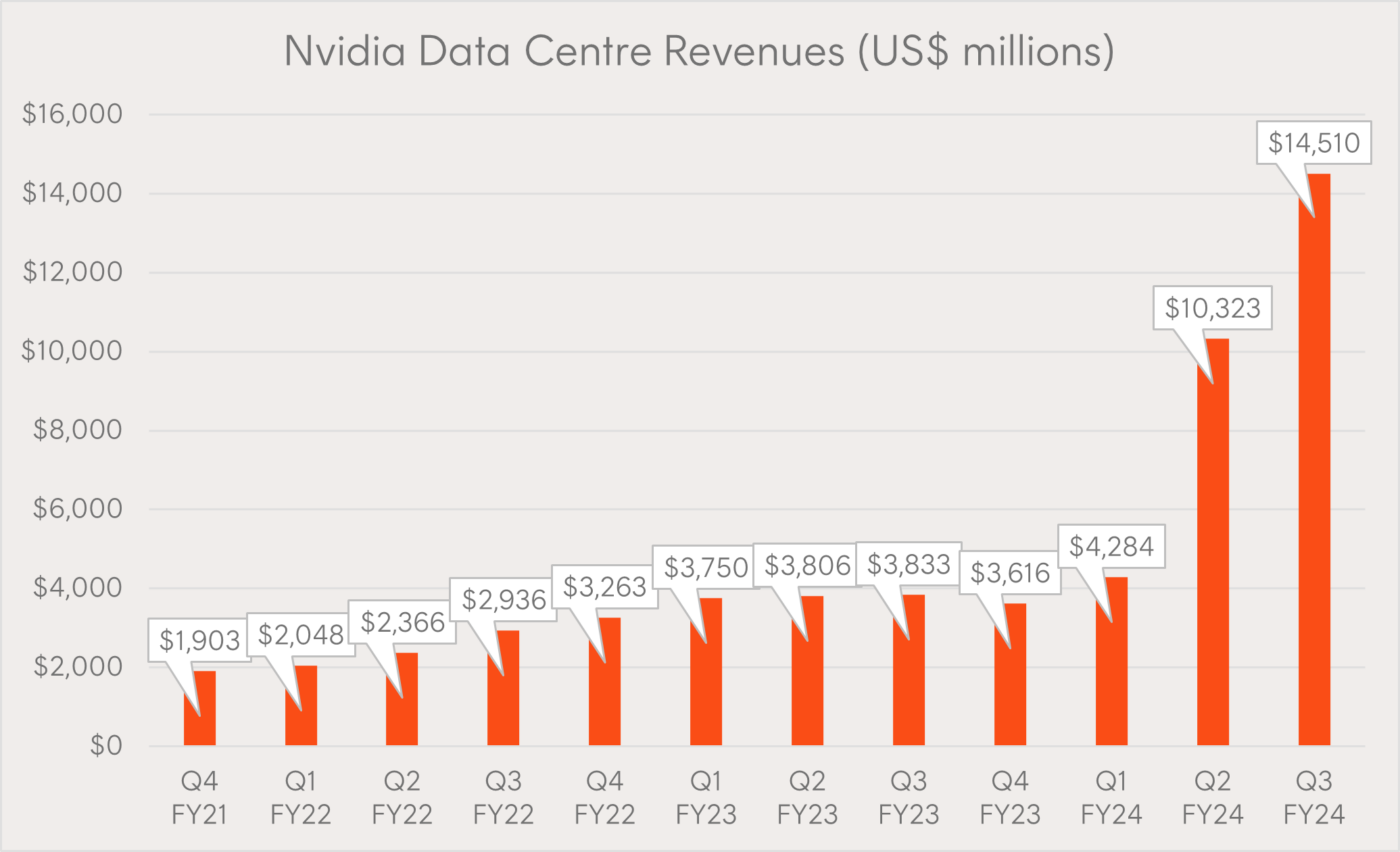
Will Nvidia maintain the momentum in 2024?
Nominated by: Cameron Gleeson, Senior Investment Strategist.
Why it’s important
NVIDIA Corp (NASDAQ: NVDA) has transformed itself from a supplier of gaming hardware to an AI-leader that’s powering development in the field. In 2023, NVIDIA’s share price jumped 240%, compared to 24% for the S&P 500, and it has seemingly become the bellwether stock for the AI industry.
And with the recent launch of their revolutionary new GH200 Grace Hopper Superchip, Nvidia appears well placed to maintain their leadership in AI and data centres.
Nvidia management provided guidance for Q4 FY24 of US$20 billion, including a QoQ fall in gaming revenues, implying that Data Centre Revenues is forecast to exceed US$17 billion.
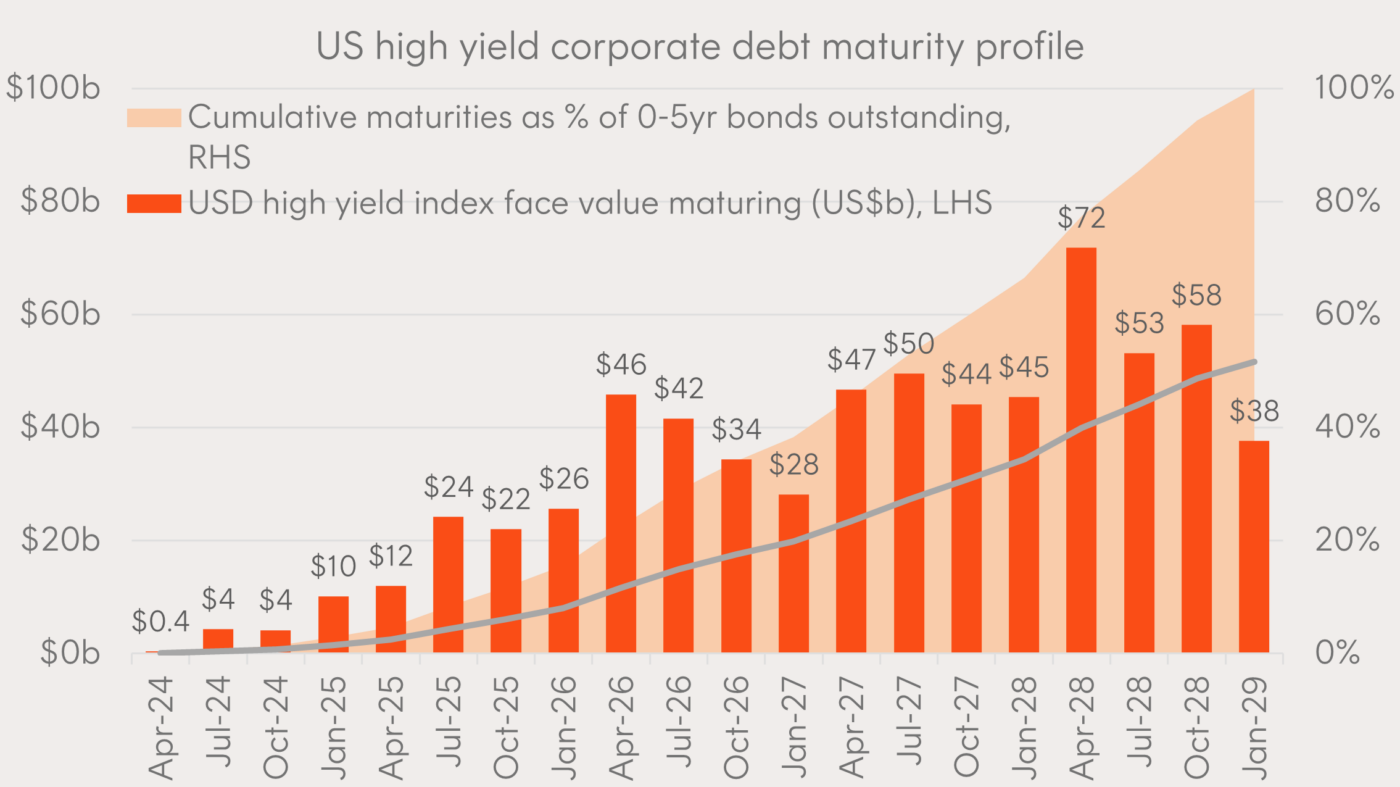
US corporates due to pay their debts
Nominated by: Chamath De Silva, CFA, Head of Fixed Income.
Why it’s important
Between April 2020 and March 2022 – the two years that the US Federal Funds Rate sat at zero – corporations issued US$1.95 trillion in high yield debt.
Much of this debt was issued with long maturities as issuers took advantage of low interest rates, so just US$227 billion has matured so far. As the rate of maturities picks up towards the end of this year, corporates will need to decide whether to roll the debt over at new (higher) interest rates or pay it out in cash (assuming they can).
If neither of these options are possible, we may see a tick-up in defaults.
Large caps outperformed in 2023: Will it continue?
Nominated by: Tom Wickenden, Investment Strategist.
Why it’s important
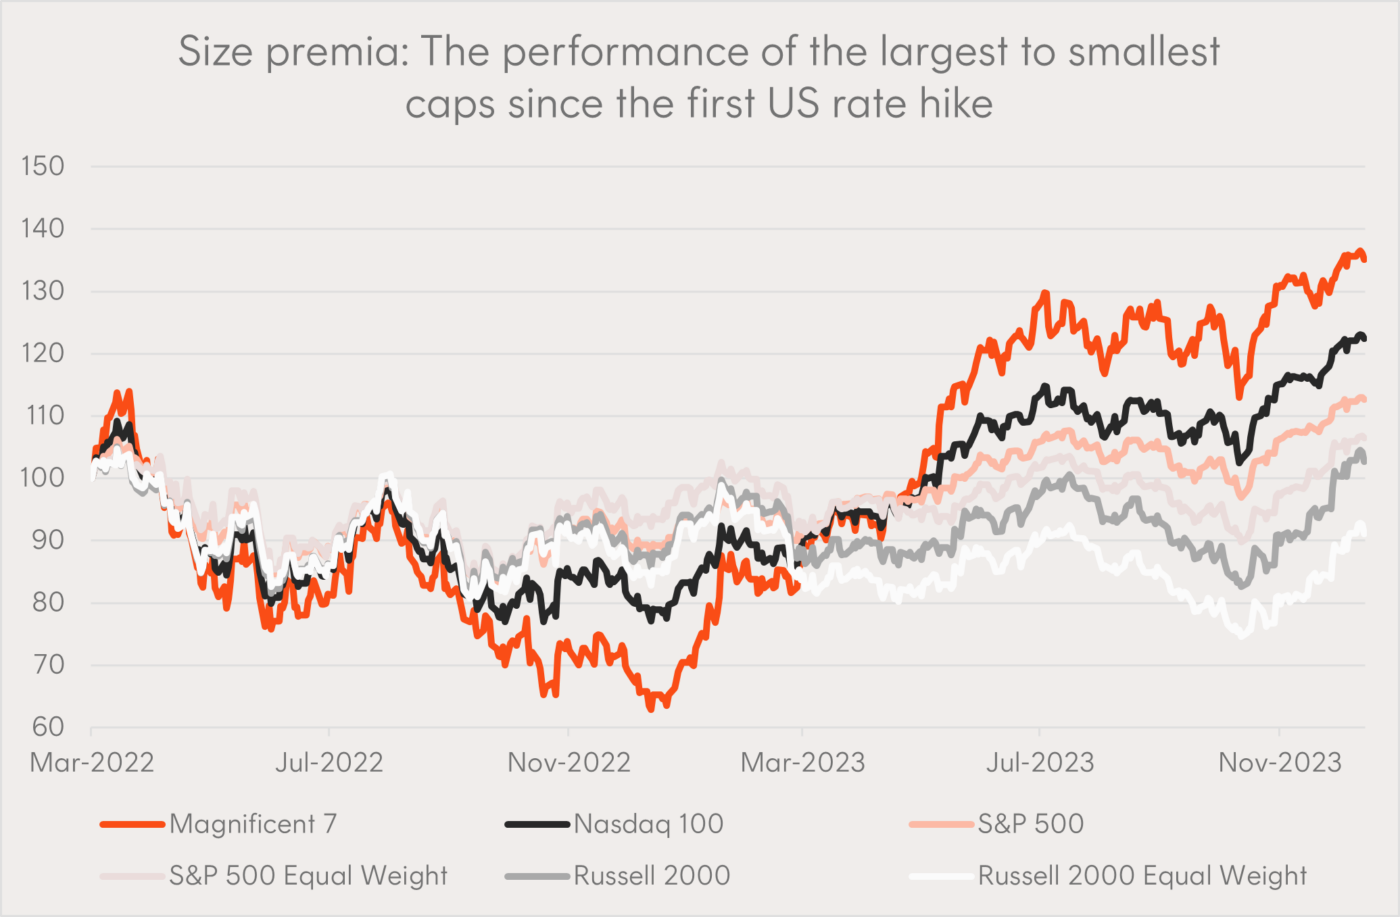
Conventional wisdom did not prevail this rate hiking cycle as the longest duration large cap technology stocks outperformed.
As we head into 2024, market commentary will be fixated on how, when, and why rates are cut. For investors, the big question is which companies will be the biggest beneficiaries from the rate cutting cycle.
If market breadth improves and the mid- and small-cap stocks catch up to the large caps, some investors may wish to consider Betashares S&P 500 Equal Weight ETF (ASX: QUS).
Investment required to fill the gap
Nominated by: Patrick Poke, Editorial Director.
Why it’s important
Nuclear energy provided about 10% of global electricity production in 2022 and was the second biggest source of clean energy (behind hydroelectricity).
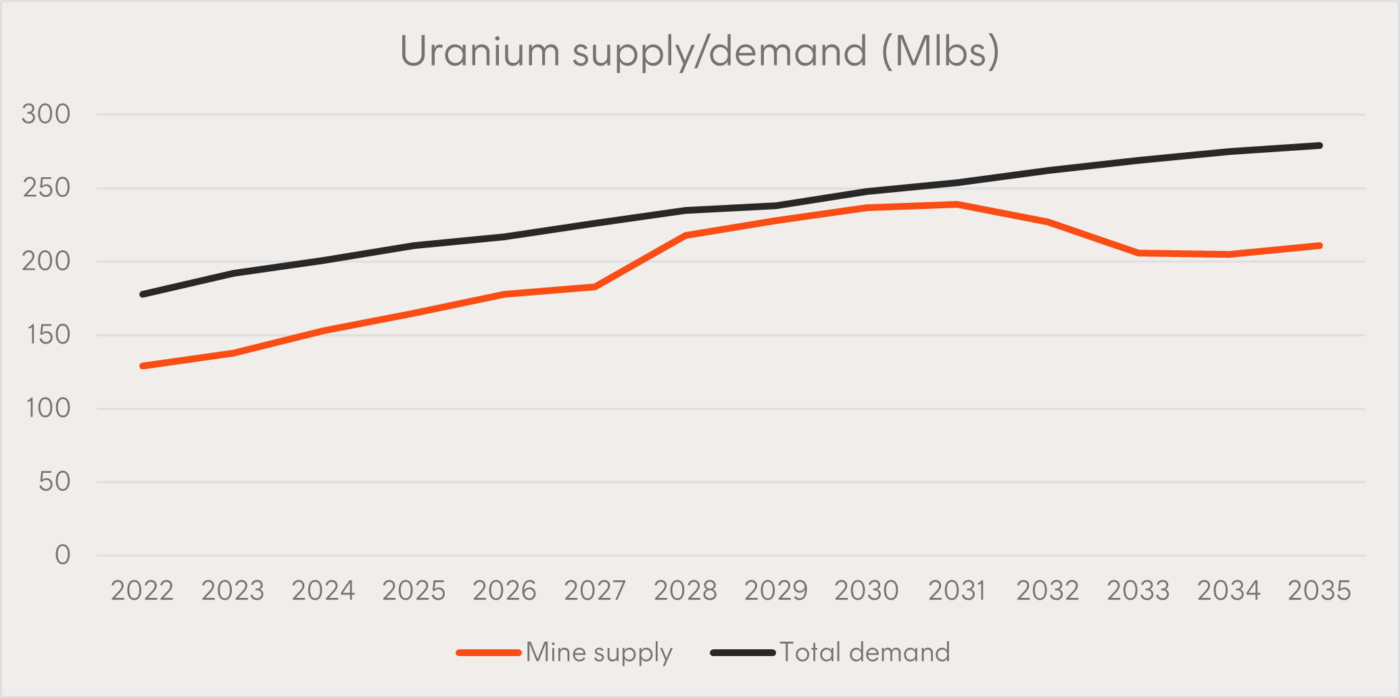
At the risk of stating the obvious, without uranium, nuclear power plants cannot produce electricity. Following years of underinvestment in new uranium supply, the gap between production and demand has reached around 30,000 tons of uranium.
Without significant investment in new uranium production, this gap is projected to expand over the coming decades.

