Changes are happening - please bear with us while we update our site.

Changes are happening - please bear with us while we update our site. Click here to give us your advice and feedback.

Charts of the month: January 2024

A wrap up of the charts catching our eye over the past month.

As the first month of 2024 comes to an end, we take a look at some of the biggest topics for the year ahead. Will ‘unloved’ regions like China be able to stage a comeback? Will the oil price remain resilient in the face of geopolitical tensions? And how are central banks’ higher interest rates impacting companies?

Will the jaws close in 2024?

The divergence in performance between the US’ largest technology names and Chinese companies listed in the US – represented by the NASDAQ Golden Dragon China Index (INDEXNASDAQ: HXC), which is dominated by China’s largest technology names – grew to 220% over the 12 months to 31 December 2023. Many investors are pondering what the next 12 months will hold and whether the US’ technology companies can continue to outperform, or if market breadth will improve and currently ‘unloved’ sectors and regions, like Chinese technology companies, can start to close this gap.

Chart 1: Total return of the US’ ‘Magnificent 7’ versus the Nasdaq Golden Dragon China Index
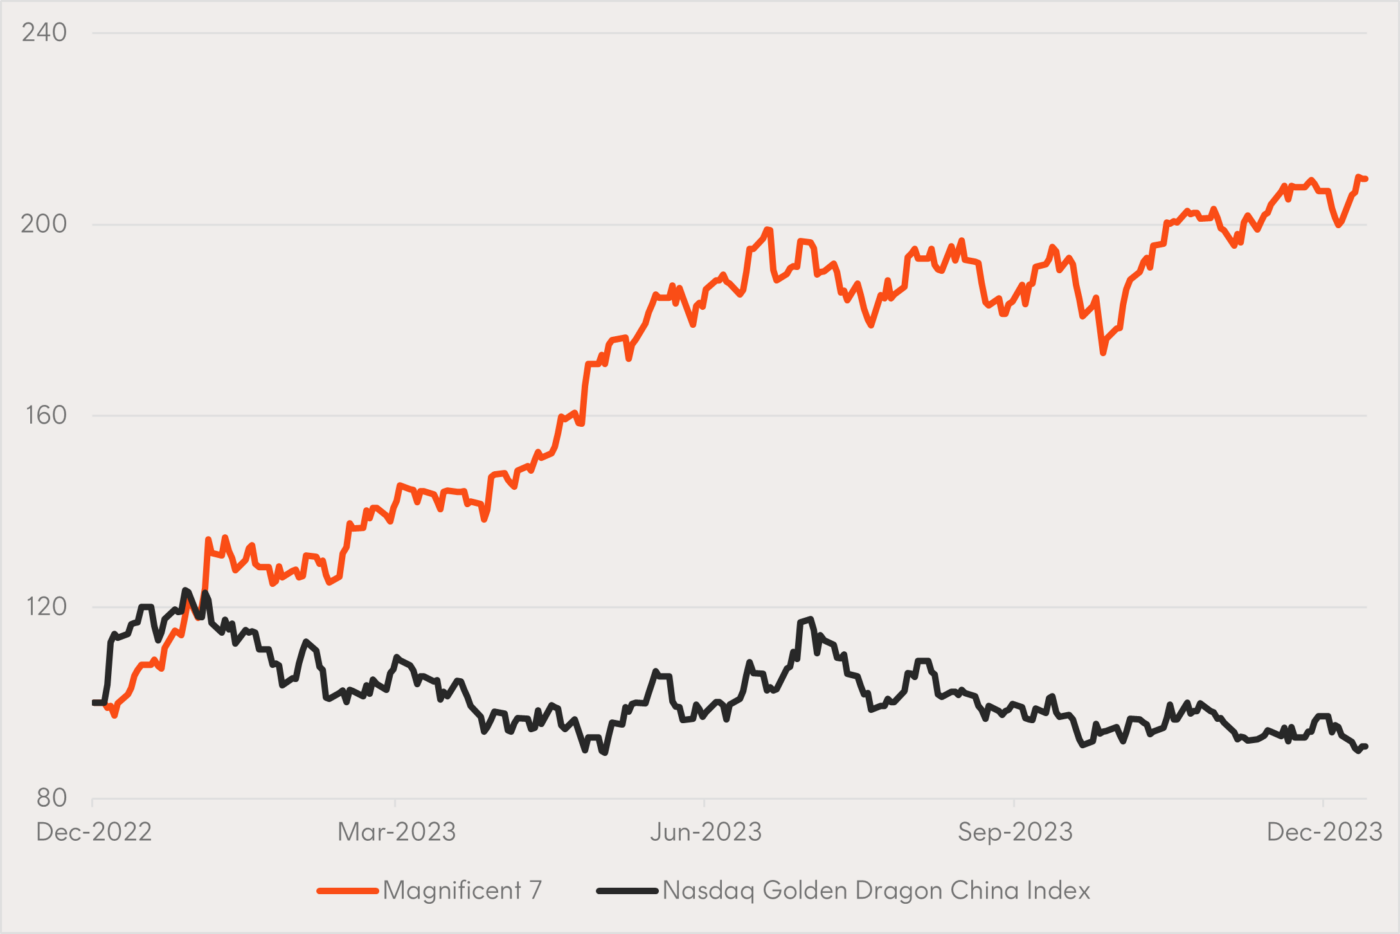
Source: Bloomberg. 31 December 2022 to 12 January 2024. You cannot invest directly in an index. Past performance is not an indicator of future performance.

The US oil buffer

Incredible growth in petroleum production in the States has lessened pressure on global oil prices despite tensions in the Middle East. As of November 2023, US was producing one in five barrels of petroleum-related product globally.

Chart 2: US total consumption and production of petroleum
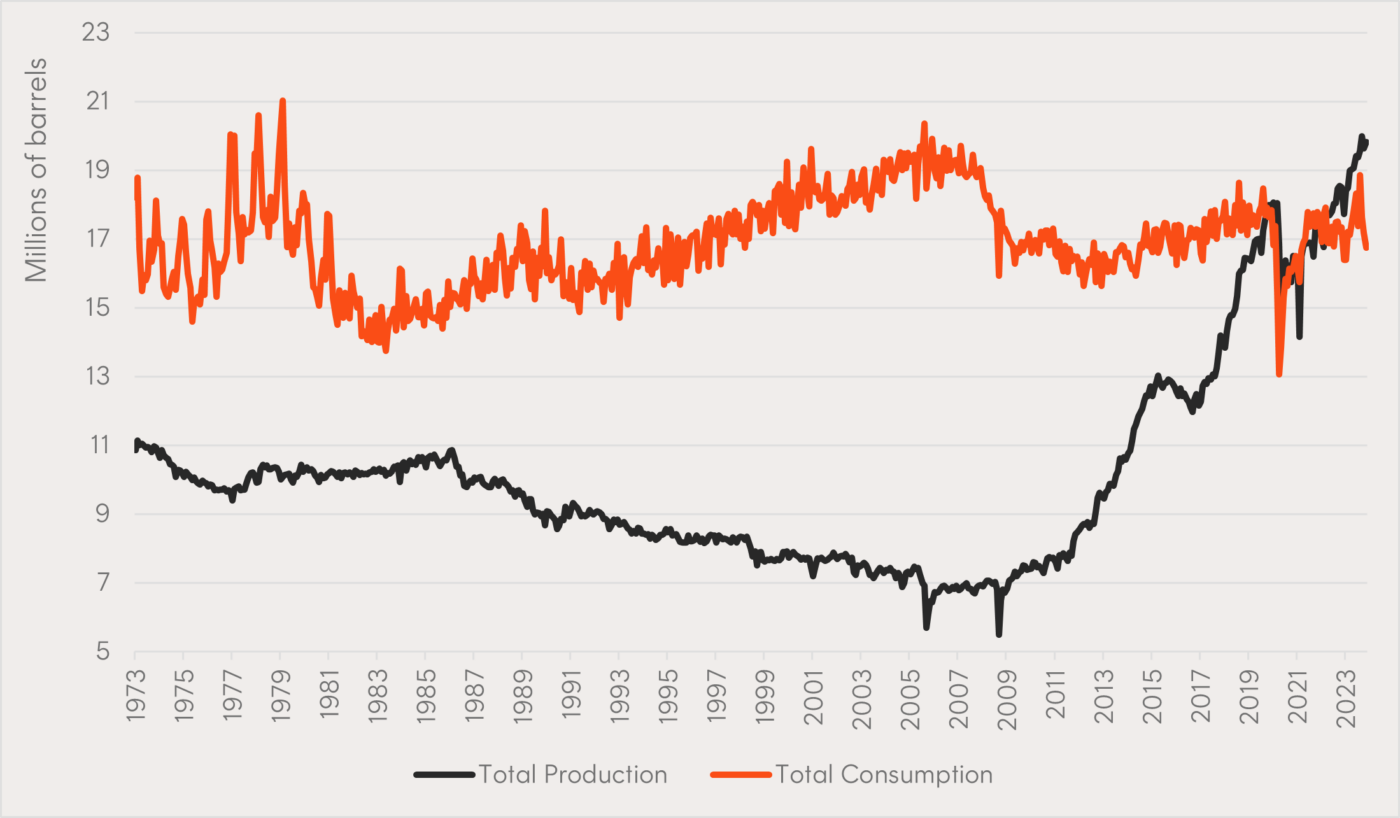
Source: US Energy Information Administration. November 2023. Including Biofuel and Processing Gains.

India overtakes Hong Kong

For the first time, India’s stock market capitalisation has overtaken Hong Kong’s. The timing of this changing of the guard is appropriate in a year where much is being discussed about the future growth prospects of both India and China.

Chart 3: Market capitalisation of Indian and Hong Kong stock exchanges
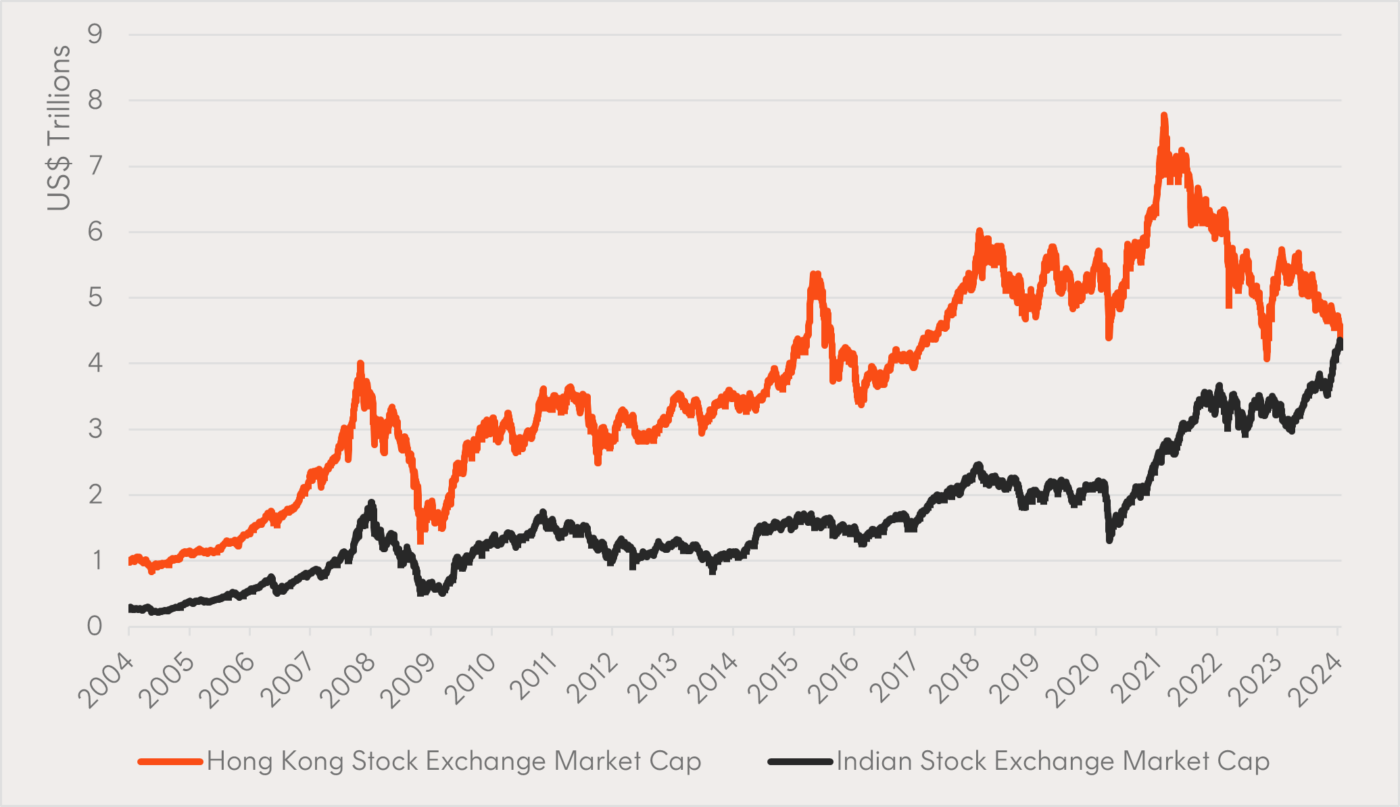
Source: Bloomberg. From 1 January 2004 to 22 January 2024.

The reaction function

The outcome of the fastest rate hiking cycle in US history has surprised many, particularly the resilience the largest growth stocks have shown in a higher rate environment. At least one interesting factor in favour of these companies has been the minimal impact on borrowing costs, as many took out longer term loans when rates were low, dampening the effects of the Fed’s reaction function. Many of these companies also carry large amounts of cash, with the higher rates paid on this cash offsetting the higher interest expense.

Chart 4: Microsoft’s quarterly interest expense and the Fed Funds rate
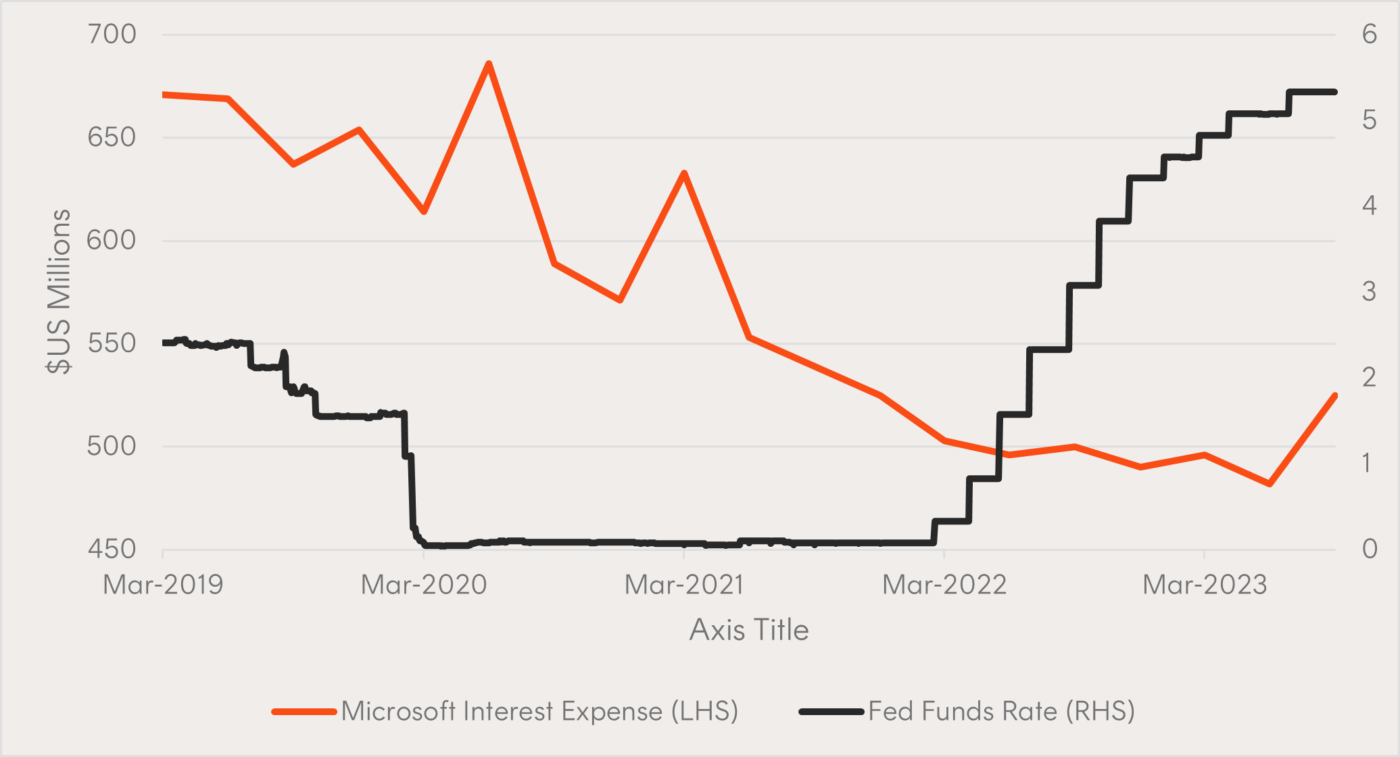
Source: Bloomberg

A different kind of concentration

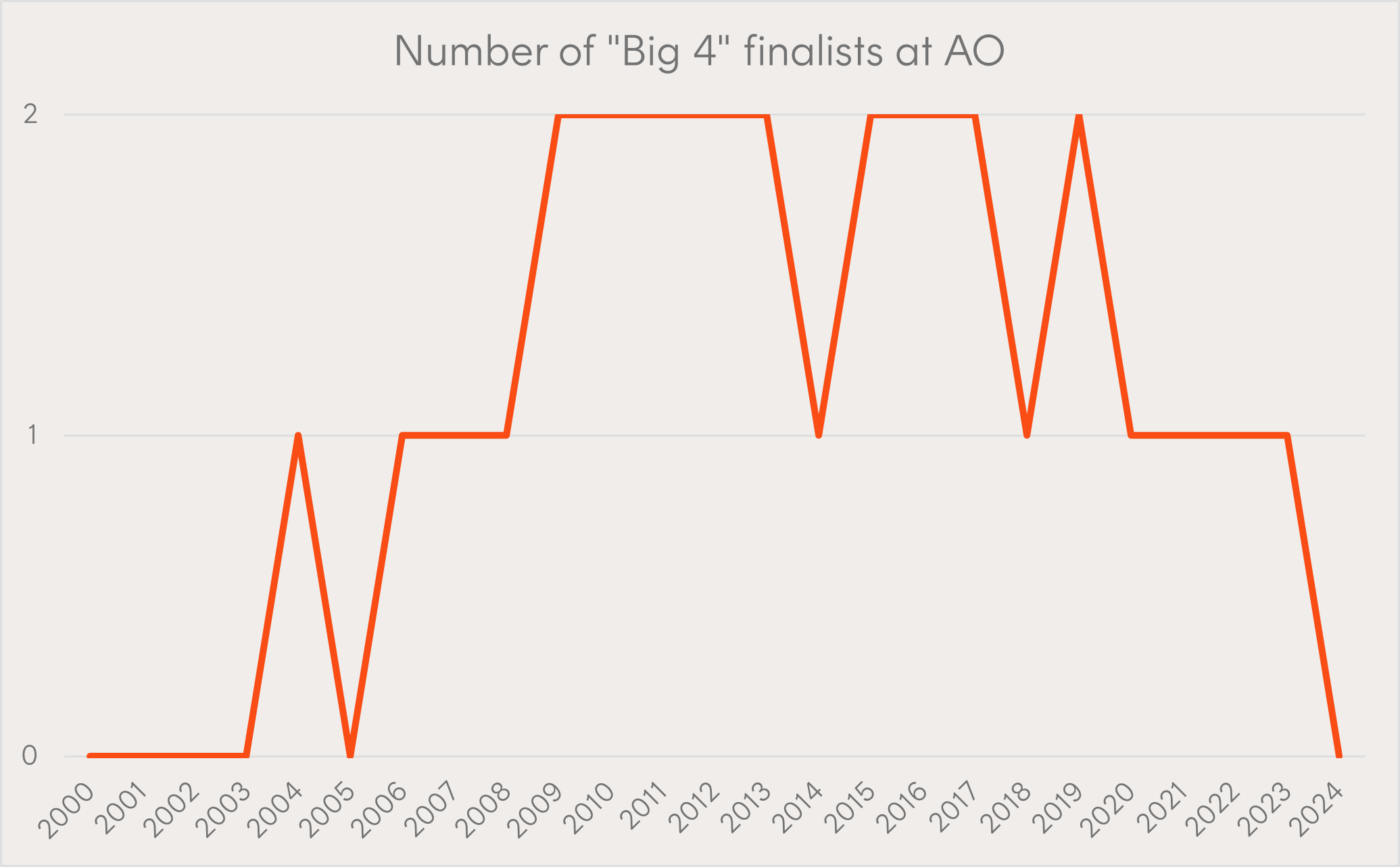
On the lighter side of charts we have enjoyed over the past month, this Australian Open final marked the first since 2005 that did not involve one of tennis’ ‘Big 4’ (for the non-tennis fans, that’s Federer, Nadal, Djokovic, and Murray). This got us thinking about market concentration and the tendancy for the largest companies in an index to change over time. Luckily these thoughts didn’t persist as long as the five-set match.

Chart 5: Number of “Big 4” finalists at the Australian Open
2024 ETF Playbook: Coming in to land

Download our special report to see the economic and market outlook from our Chief Economist, 12 ETF ideas for the year ahead, and 6 charts you can’t ignore in 2024.

Betashares Disclaimer: Betashares Capital Limited (ABN 78 139 566 868, AFSL 341181) is the issuer of Betashares Invest, being the IDPS-like scheme available through the Betashares Direct platform. Before opening an account or making an investment decision, read the Product Disclosure Statement and the Target Market Determination for Betashares Invest, available by emailing Customer Support at [email protected] or by phone on 1300 487 577, to consider whether the product is right for you. You may also wish to consider the relevant Target Market Determination, which sets out the class of consumers that comprise the target market for the Betashares Fund and is available at www.betashares.com.au/target-market-determinations. This information is general in nature and doesn’t take into account any person’s financial objectives, situation or needs. You should consider its appropriateness taking into account such factors and seek professional financial advice. Investments in Betashares Funds are subject to investment risk and the value of units may go up and down. The performance of any Betashares Fund is not guaranteed by Betashares or any other person. Past performance is not indicative of future performance.


Information warning: The information on this website is published by The Rask Group Pty Ltd (ABN: 36 622 810 995) is limited to factual information or (at most) general financial advice only. That means, the information and advice does not take into account your objectives, financial situation or needs. It is not specific to you, your needs, goals or objectives. Because of that, you should consider if the advice is appropriate to you and your needs, before acting on the information. If you don’t know what your needs are, you should consult a trusted and licensed financial adviser who can provide you with personal financial product advice. In addition, you should obtain and read the product disclosure statement (PDS) before making a decision to acquire a financial product. Please read our Terms and Conditions and Financial Services Guide before using this website. The Rask Group Pty Ltd is a Corporate Authorised Representative (#1280930) of AFSL #383169.


At the time of publishing, the author or their clients may have a financial interest in some of companies or securities mentioned.

Powered by

Skip to content