Changes are happening - please bear with us while we update our site.

Changes are happening - please bear with us while we update our site.

Private credit companies generate income by lending to and investing in non-public businesses using a variety of sources, such as debt and hybrid financial instruments.

In short, they provide capital to small and medium-sized private businesses, and in turn, give investors access to the growth and income potential of private credit that are generally exclusive to large institutions and difficult to access.

Most listed private credit companies are closed-end funds that hold a portfolio of loans and distribute to their investors most of the net income from the private companies they lend to.
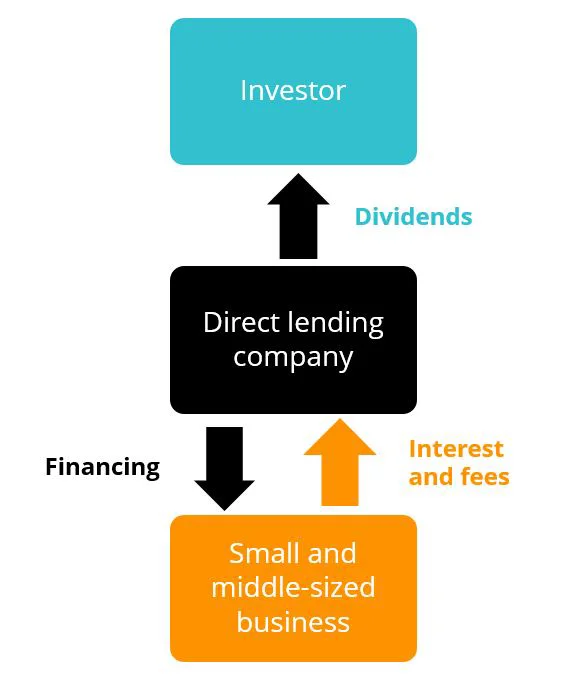
You can see in the above, that private credit companies issue loans to small and middle-sized non-public companies. They collect fees and interest on the loans they issue.

In some jurisdictions, there are rules about how much listed private credit companies are required to distribute to their investors. For example, in the US, given their status as a registered investment company under the Investment Company Act of 1940, private credit companies are required to distribute at least 90% of their net investment income to shareholders. For this reason, investing in private credit companies is associated with income investing.

And you can see the allure for investors. Chart 1 below shows the yield of listed private credit, as at 31 December 2023, is significantly higher than other asset classes.

Chart 1: Private credit offers attractive yield
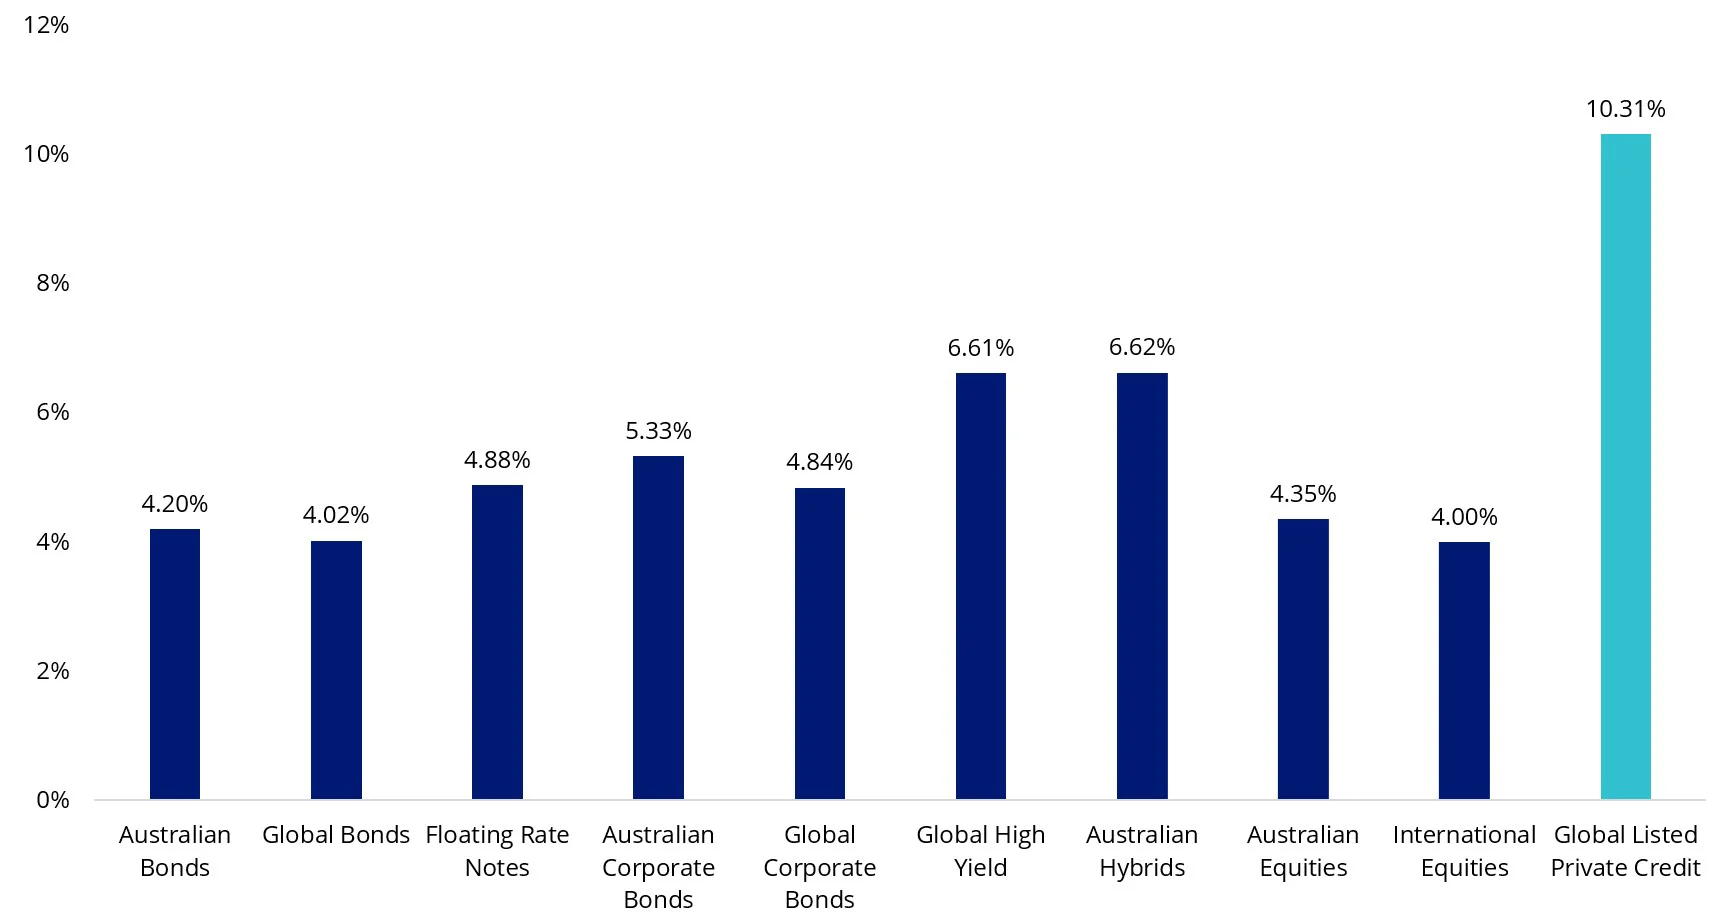
As at 31 December 2023. Source: Bloomberg Direct, Yield is either yield to maturity or dividend yield. Results are calculated weekly and assume immediate reinvestment of all dividends. You cannot invest in an index. Past performance is not a reliable indicator of future performance. Yield to Maturity (YTM) is the estimated annual rate of return that would be received if the fund’s current securities were all held to their maturity and all coupons and principal were made as contracted. YTM does not account for fees or taxes. YTM is not a forecast, and is not a guarantee of, the future return of the fund which will vary from time to time. Dividend Yield is the weighted average of each portfolio security’s distributed income during the prior twelve months before management costs. If applicable it does not include franking credits. Unless noted. *For Australian Hybrids grossed up running yield has been used. Running yield is the annual coupon weighted by the current market value, divided by the current market value of the securities. Running yield is not a forecast, and is not a guarantee of, the future return of the fund which will vary from time to time The grossed up number is inclusive of franking credits and assumes that the full benefit of franking is applicable. Indices used: Australian Bonds – Bloomberg AusBond Composite 0+ Yr Index; Global Bonds – Barclays Global Aggregate Bond Index A$ Hedged; Floating Rate Notes – Bloomberg AusBond Credit FRN 0+ Yr Index; Australian Corporate Bonds – Bloomberg AusBond Credit 0+ Yr Index; Global Corporate Bonds – Bloomberg Barclays Global Aggregate Corporate Bond Index (AUD Hedged); Global High Yield – Markit iBoxx Global Developed Markets Liquid High Yield Capped Index (AUD Hedged); Australian Hybrids is Solactive Australian Hybrid Securities Index;  Australian Equities – S&P/ASX 200 Accumulation Index; International Equities – MSCI World ex Australia Index; Global Listed Private Credit is LPX Listed Private Credit AUD Hedged Index.

And it has been able to maintain this level of yield over time, even during the low-rate environments following the GFC and COVID. Over the past 15 years, the dividend yield of the Global Listed Private Credit Index has averaged around 8.6% p.a. As always, this is not indicative of the future performance of LEND.

Chart 2: Private credit offers attractive dividend yields: Dividend yield of LPX Listed Private Credit AUD Hedged Index
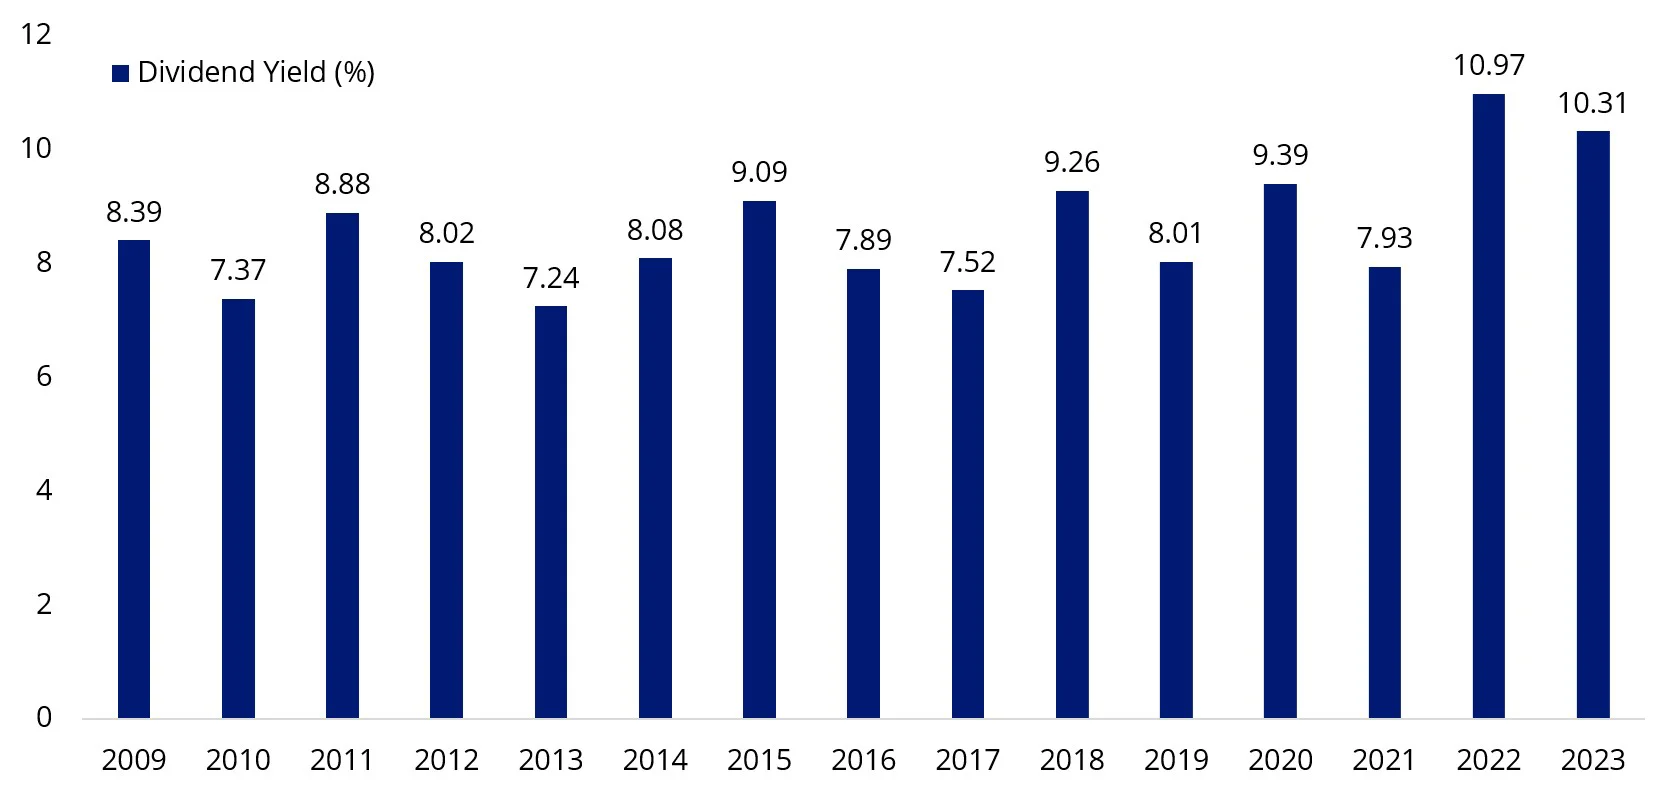
Source: LPX AG Data Basis: DLX Universe; December 31, 2023. You cannot invest in an index. Past performance is not a reliable indicator of future performance.

In bond markets higher income generally comes at the cost of higher volatility. This is true of global listed private credit, which historically, while paying a higher yield, experiences more volatility, or risk.

Chart 3 and table 1: 15 year risk vs yield as at 31 December 2023
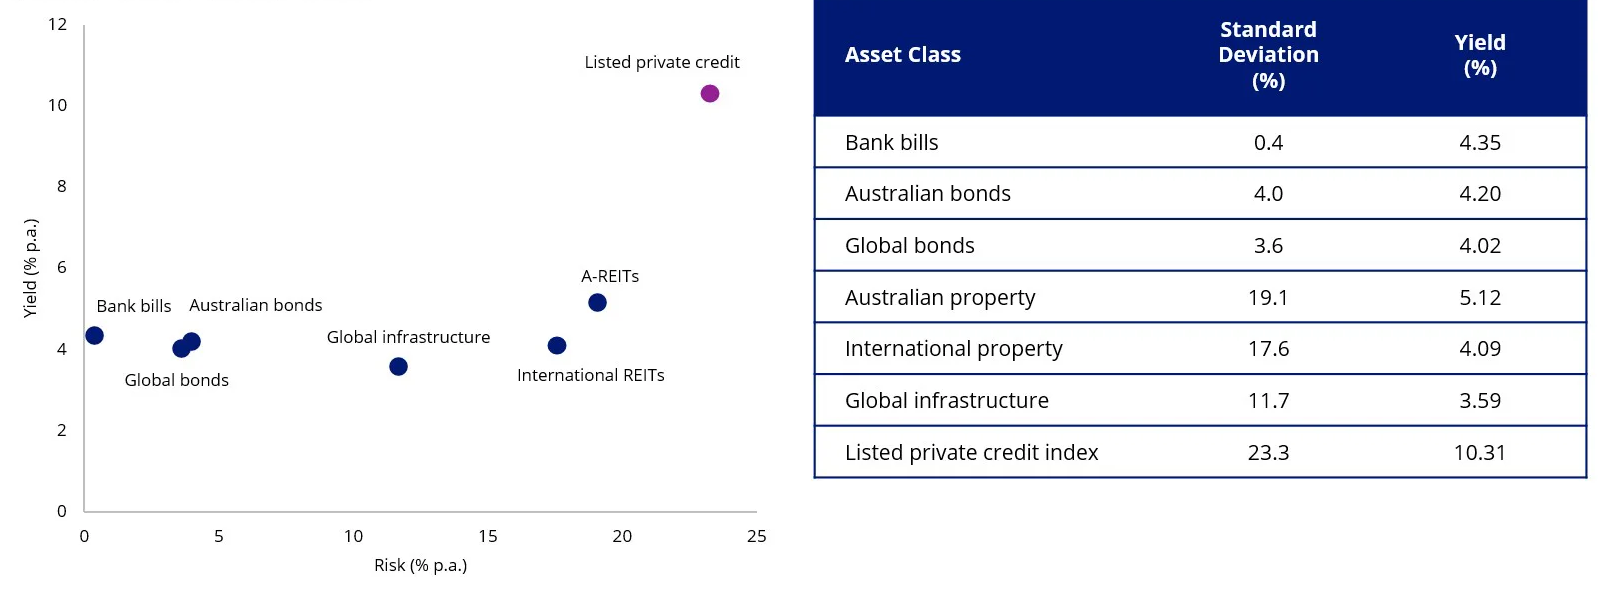
Source: Morningstar Direct. Risk results are calculated using a monthly return series and results are calculated monthly and assume immediate reinvestment of all dividends. You cannot invest in an index. Past performance is not a reliable indicator of future performance. Indices used Bank Bills – Bloomberg AusBond Bank Bill Index, Global Bonds – Barclays Global Aggregate Bond Index A$ Hedged , Australian Bonds – Bloomberg AusBond Composite 0+ years, Australian Property – S&P/ASX 200 A-REITs Index, International Equities – MSCI World ex Australia Index , Australian Equities – S&P/ASX 200 Accumulation Index, Emerging markets equities – MSCI Emerging Markets Index, Listed private equity – LPX Listed Private Credit Index.

To date, private credit investment has been generally limited to high net worth and the big end of town who don’t require immediate access to cash and can take concentrated positions. This is because private credit has generally only been available through restricted closed-end funds that have large minimum investments and are illiquid.

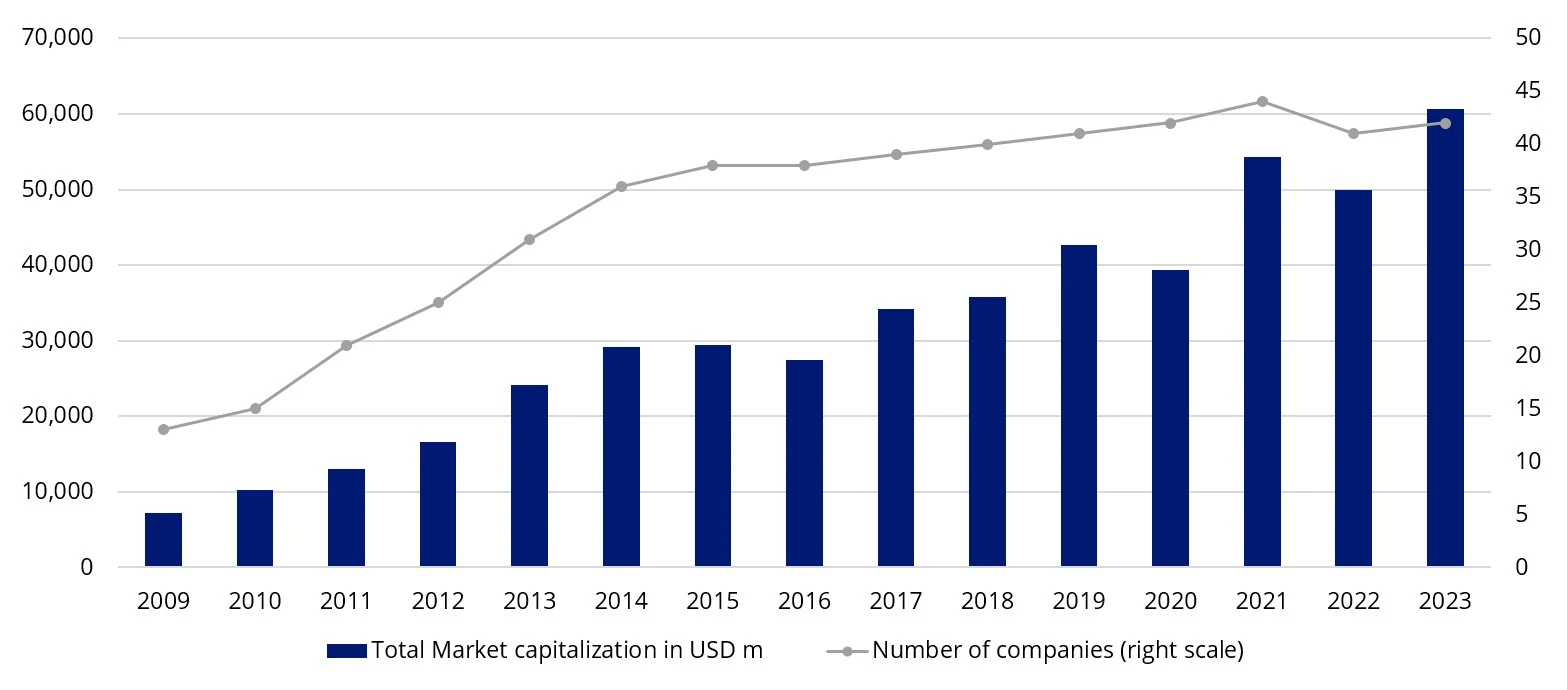
The rise of listed private investment companies has allowed investors to access this asset class via an exchange. According to index provider LPX, the universe of listed private credit companies globally is 42, having been growing since 2009.

Chart 4: The universe of listed private credit companies has been steadily expanding
Listed Private Credit Companies, including those managed by KKR & Co Inc (NYSE: KKR), Ares Management Corp (NYSE: ARES), Blackstone Inc (NYSE: BX) and Goldman Sachs Group Inc (NYSE: GS) may specialise in sectors or loan types and risks vary between companies. For diversity, investors generally need to invest in a portfolio of listed private credit companies.

Smart investors are simply those most informed

Gain market analysis, ETF updates and investment strategies from the experts at VanEck.

Information warning: The information on this website is published by The Rask Group Pty Ltd (ABN: 36 622 810 995) is limited to factual information or (at most) general financial advice only. That means, the information and advice does not take into account your objectives, financial situation or needs. It is not specific to you, your needs, goals or objectives. Because of that, you should consider if the advice is appropriate to you and your needs, before acting on the information. If you don’t know what your needs are, you should consult a trusted and licensed financial adviser who can provide you with personal financial product advice. In addition, you should obtain and read the product disclosure statement (PDS) before making a decision to acquire a financial product. Please read our Terms and Conditions and Financial Services Guide before using this website. The Rask Group Pty Ltd is a Corporate Authorised Representative (#1280930) of AFSL #383169.


VanEck Disclaimer: VanEck Investments Limited (ACN 146 596 116 AFSL 416755) (VanEck) is the issuer and responsible entity of all VanEck exchange traded funds (Funds) trading on the ASX. This is general advice only and does not take into account any person’s financial objectives, situation or needs. The product disclosure statement (PDS) and the target market determination (TMD) for all Funds are available at vaneck.com.au. You should consider whether or not an investment in any Fund is appropriate for you. Investments in a Fund involve risks associated with financial markets. These risks vary depending on a Fund’s investment objective. Refer to the applicable PDS and TMD for more details on risks. Investment returns and capital are not guaranteed.


Key Risks: An investment in any of the Funds carries risks. These risks vary and are generally more pronounced in equities funds when compared to fixed income funds. It is important that you read the relevant PDS for details about the risks associated with each of the Funds.

At the time of publishing, the author or their clients may have a financial interest in some of companies or securities mentioned.

Powered by

Skip to content