ETF and Australian share market investors alike often wonder, should I invest in the ASX 20 (blue chips), ASX 100 (large and medium), ASX 200 (large, medium and a few small) or ASX 300 (all of it).
To track these indices, you have the following popular ETFs:
- Top 20 (size based) – iShares S&P/ASX 20 ETF (ASX: ILC)
- Top 100 (equal weight) – VanEck Australia Equal Weight ETF (ASX: MVW)
- Top 200 (size based) – BetaShares Australia 200 ETF (ASX: A200) and iShares Core ASX 200 ETF (ASX: IOZ)
- Top 300 (size based) – Vanguard Australian Shares Index ETF (ASX: VAS)
Top performing ASX shares ETFs
| A200 | Betashares Australia 200 ETF | 8.85% |
| IOZ | iShares Core S&P/ASX 200 ETF | 8.50% |
| ILC | iShares S&P/ASX 20 ETF | 9.65% |
| MVW | VanEck Australian Equal Weight ETF | 7.44% |
| QOZ | Betashares FTSE RAFI Australia 200 ETF | 9.30% |
| STW | SPDR S&P/ASX 200 | 8.68% |
| SFY | SPDR S&P/ASX 50 | 8.66% |
| VAS | Vanguard Australian Shares Index ETF | 8.56% |
| VLC | Vanguard MSCI Australian Large Companies Index ETF | 10.28% |
Over the past five years, to June 30th 2024, you can see the top performing Australian shares ETFs are the:
- Vanguard MSCI Australian Large Companies Index ETF (ASX: VLC), which is a tiny ETF that has 19 holdings.
- iShares S&P/ASX 20 ETF (ASX: ILC), which tracks the top 20.
- Betashares FTSE RAFI Australia 200 ETF (ASX: QOZ), which uses something called ‘fundamental size’ to pick and hold companies.
Of the most popular ETFs in Australia, it would be fair to say BetaShares Australia 200 ETF has been the most successful in terms of total return. But this is probably because it has fractionally lower fees than VAS, IOZ and STW.
The once top performing MVW has been outpaced in this five-year block, probably because it has really high fees in comparison to the others (0.35% versus 0.04% for A200) and because mid-cap stocks were punished during Covid.
The thing is, past performance is not indicative of future performance. So how can we use data to actually help us make an informed choice?
To prepare for the next Rask Invest quarterly update, I looked at data on over 450 Australian companies over 10 years and here’s what I found.
What data tells us about the ASX 200
Specifically, on the ASX I wanted to know:
- Does the ASX 20 actually grow slower than the ASX 100/200/300?
- Do companies outside the ASX 20 but inside the ASX 200 grow faster?
- Which cohort has the strongest dividend growth?
- Which cohort shows the strongest top-line / sales growth?
- What does the financial data tell us about the ‘stages of growth’ for companies on the ASX?
- Finally, which companies top the charts for each metric of dividend growth, profit/earnings growth, return on capital, and sales growth?
Take a look and let me know which patterns you see in the free Rask community.
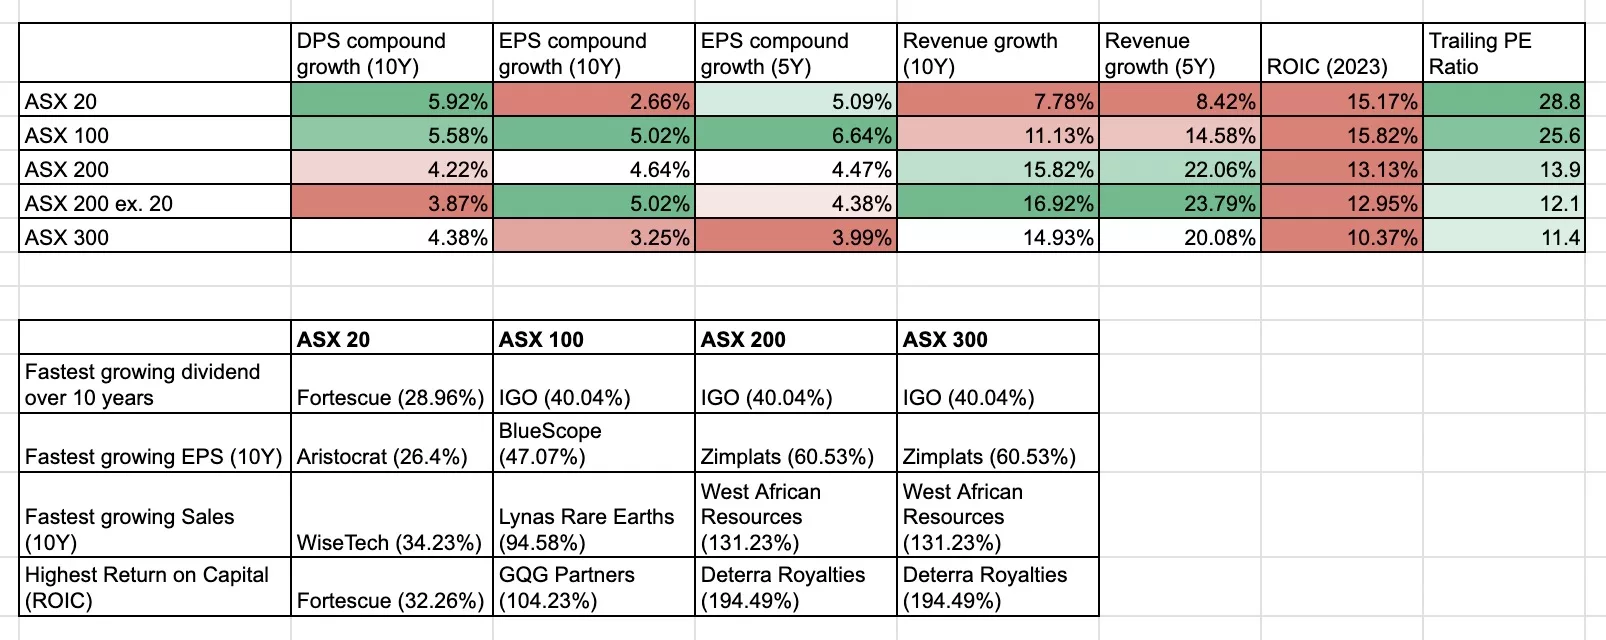
Key takeaways from the ASX 200 data
Here the five key takeaways from the ASX 200, ASX 20 and ASX 100 company data:
- ASX 100 companies exhibit faster profit and dividend growth
- ASX 200 excluding the 20 companies exhibit the fastest revenue growth (and looks like the strong growth spills over into the top end of the ASX 300)
- ASX 300 includes quite low profitability
- ASX 100 has the highest return on capital (ROIC) – which is surprising consider how our incumbent ASX 20 companies have persisted. ROIC measures the profitability of a company’s growth.
- Shares inside the ASX 20 are much more expensive (based on raw PE ratios) than any other part of the market (but you should know that’s pretty normal, since they are higher quality and more stable)
- African-based resources stocks always ruin it. Don’t trust it.
ASX 200 thoughts & takeaways
Here are some very brief takeaways I got from crunching the data for Rask Invest:
- Investors really should have some exposure outside the ASX 20 if they take a 5 or 10-year view (please see the previous research on the world’s top performing stocks).
- For tax reasons, it might make sense to try and capture the growing companies outside of the ASX 200 (though I don’t have great data on this due to complex tax rules and survivorship)
- The ASX 100 may be the ‘meaty’ part for the next leg of growth for the Australian market, especially when we consider valuations.
- Mid-to-large cap Aussie stocks are growing wicked fast
Once all is said and done, it’s obvious that the worst thing an investor can do is delay investing because they’re stuck trying to pick between VAS, A200, IOZ, MVW or any other low cost, diversified, well-run Australian shares ETF. Just pick one (or two) and get on with it.
However, from a data perspective, it might make sense to blend two of these ETFs together. And for retirees, maybe throw in some dividend ETFs like Vanguard High Yield Australian Shares ETF (AS:X VHY) or SPDR MSCI Australia Select High Dividend Yield Fund (ASX: SYI) or Russell Investments High Dividend Australian Shares ETF (ASX: RDV).
As always you can ask me questions inside the Rask Community, on one of our podcasts, and view our ETF holdings on the Rask Invest website.