
The ASX reporting season has come to a close, leaving a wake of annual and half-yearly reports to trawl through to find your next big investment. So, how do you make sense of the financial statements?
Reporting season
The ‘reporting season’ for ASX shares is typically around February and October. For companies operating on a calendar year, they’ll generally put out annual reports in February and half-year results in October.
Companies operating on a July-June financial year will do the opposite.
For example, Commonwealth Bank of Australia (ASX: CBA) and Fortescue Ltd (ASX: FMG) released their half-year results in February. Whereas, Rio Tinto Ltd (ASX: RIO), who have more operations outside of Australia, released their full-year 2024 annual report.
The information you’ll find in the annual report is often a lot more detailed and contains more management commentary, but the financial statements are largely the same (as they have to follow strict rules and are audited).
Below are the 3 main statements you’ll see in company reports and how to read them. If you want to learn more about financial statements and valuing/assessing companies, check out our free valuation course.
Income statement
This is a good place to start.
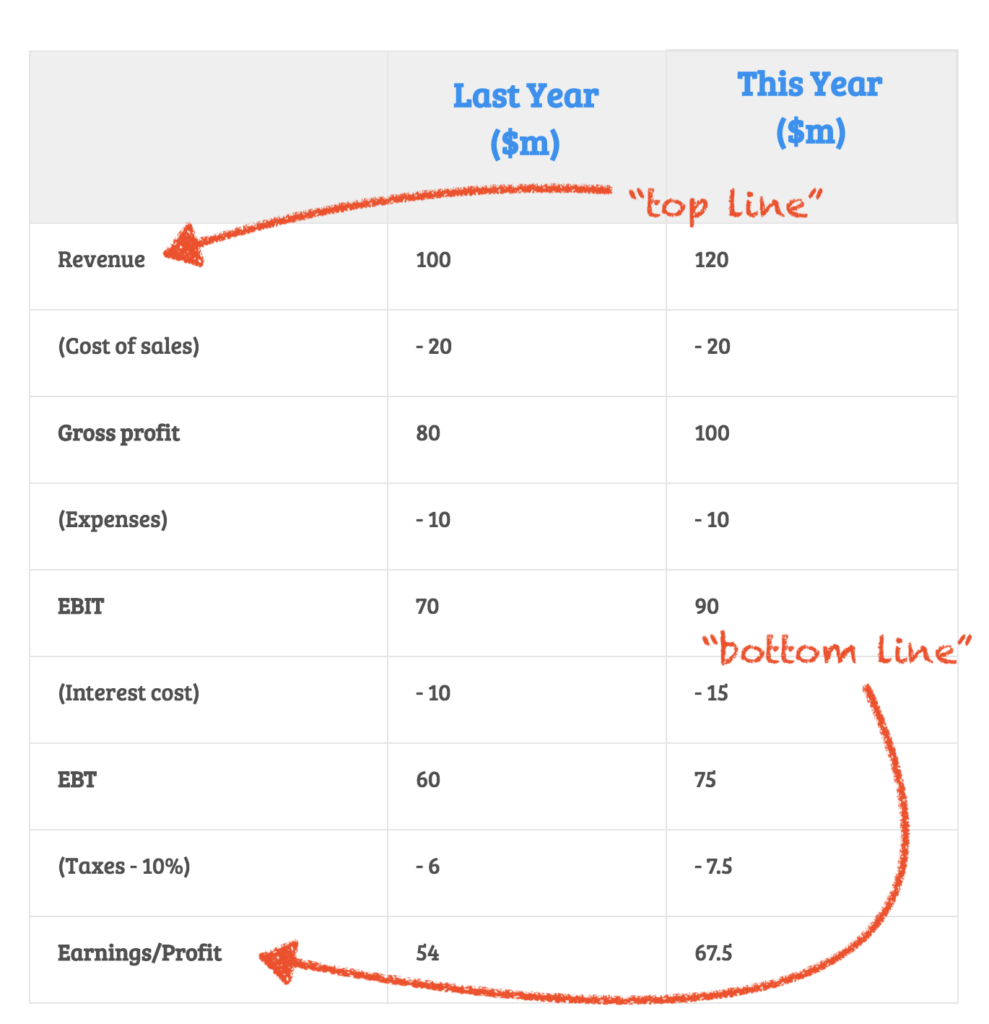
The income statement read top to bottom takes us through the top line (revenue) to the bottom line (profit).
You’ll probably see these terms in company statements and management comments – “we’re delivering top line growth” or “we’ve strengthened our bottom line” – they’re just referring to revenue and profit. Moving down from revenue:
- We take away the cost of sales (what it cost to sell the goods or services) to get gross profit, AKA operating profit
- Then take away other expenses (overhead costs like salaries, rent, etc.) to get EBIT (earnings before interest and tax)
- Then take away (you guessed it!) interest and tax to get to the net profit or what we sometimes refer to as earnings
One thing you’ll want to understand from the income statement is the trend in revenue and earnings.
Is it increasing or decreasing compared to last year? You should also look at the margins (earnings divided by revenue) – how much profit are they making as a percentage of revenue?
Look for any expenses that seem unusually high compared to last year. Is there any commentary to explain the increase?
The income statement should give you a good feel for the company’s profitability and the general trend in their earnings. So, let’s move on!
Balance sheet
This is where we see a snapshot of the company’s financial position.
We’re looking at debt levels, assets, and total equity. An asset is anything that makes the company money. A liability is anything that the company has to pay.
Both assets and liabilities can be current or non-current. The cut-off between current and non-current is 1 year, so anything that will be received or paid in the next 12 months is current, and everything else is non-current. The balance sheet can tell you:
- The value of the company’s assets (like machinery, property, etc.)
- How much debt the company has (and whether it’s short-term or long-term)
- The amount of cash in the bank
The other part of the balance sheet is equity. This is simply the total assets minus the total liabilities.
Think of it like home ownership – if you take the value of the house and subtract the debt owing, what remains is your equity (ownership)!
An example of something to watch out for on the balance sheet is if the company has more short-term debts than it has cash – that’s when you start asking, ‘how are they going to pay for that?’ To find the answer, you’ll need to look at the…
Cash flow statement
Speaking of cash, the best place to learn about that is the cash flow statement.
This is one of the most important tables on an annual report – it tells you how much cold hard cash the company earned that year. The cash flow statement is divided into 3 sections:
- Cash from Operations: this is the cash that is made and paid by the company to run its operations (e.g. cash collected from selling goods to a customer would be cash in-flow)
- Cash from Investing: This is cash received or paid to sell or buy long-term assets for the business (e.g. paying $50 million to buy a piece of property would be cash out-flow)
- Cash from Financing: this is cash used to keep the business afloat (e.g. the company gets a bank loan for $20 million, that’s a cash in-flow).
Have a look at the total cash held at the end of the reporting period – did it go up or down? By how much?
If it went up, is that because they took on a new loan, or did receipts from customers increase?
If it went down, is that because they’re not bringing in enough cash, or is it because they made a one-off investment in new equipment (which might not be an issue)?
You may need to look at a few years’ worth of cash flow statements to get to the bottom of it, as one-off investments or loans can change the number pretty substantially.
But, ultimately, what we want to see is that the business is cash flow-positive – i.e. they earn more cash than they spend.
Further learning
Getting a handle on each of these three statements can take a bit of time, but the best way to learn is to start practicing!
Most companies on the ASX put out a half-yearly or annual report in the last 2 months – go find a company you’re interested in and read their report.
See if you can spot any of the things we said to look out for. And if you want to go one step further, enrol in our free online valuation course to learn how to turn these statements into an estimated share price.
