
Would you buy these 5 passive income ASX stocks for retirement?
We pull apart the remaining ASX shares from last week, including Cochlear Limited (ASX: COH), Macquarie Group Ltd (ASX: MQG) and more.

We pull apart the remaining ASX shares from last week, including Cochlear Limited (ASX: COH), Macquarie Group Ltd (ASX: MQG) and more.
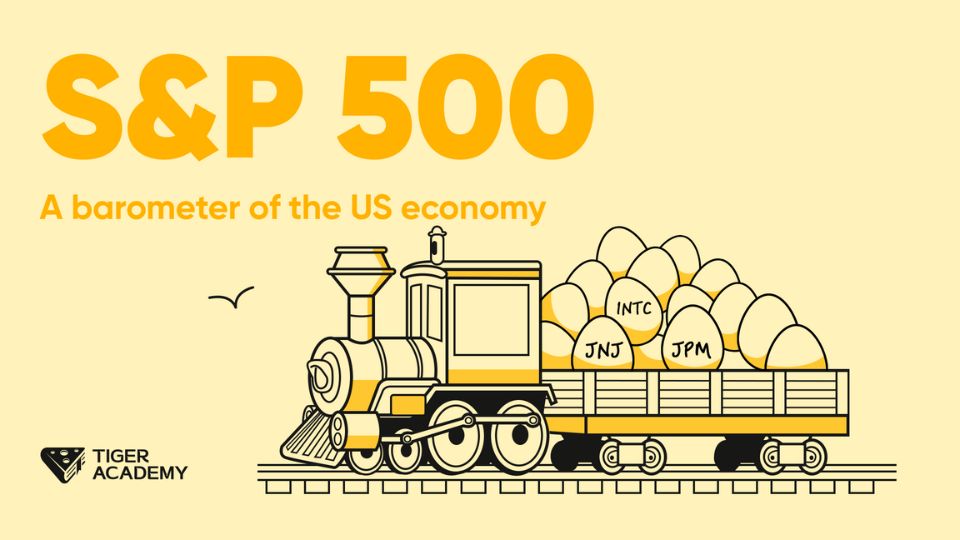
The S&P 500 index was compiled by Standard & Poor’s in 1957. It was originally made up of 425 industrial stocks, 15 railroad stocks, and 60 utility stocks, known as the S&P 500.

One key feature to watch out for is whether the company or ETF offers a DRP, or Dividend Reinvestment Plan. This is an option where you can choose to receive additional shares/units in your investment, rather than receiving a cash payment.

Whether this person is your partner, sister, friend from high school or that dude that works in IT, finding a handful of people to act as your accountability partners (your very own truth pod), is an important step in improving your decision-making skills and becoming a better investor.

There’s a lot of ways you can be led astray when it comes to investing, but one of your biggest battles will come from within. More specifically, I’m talking about those pesky things we call emotions.
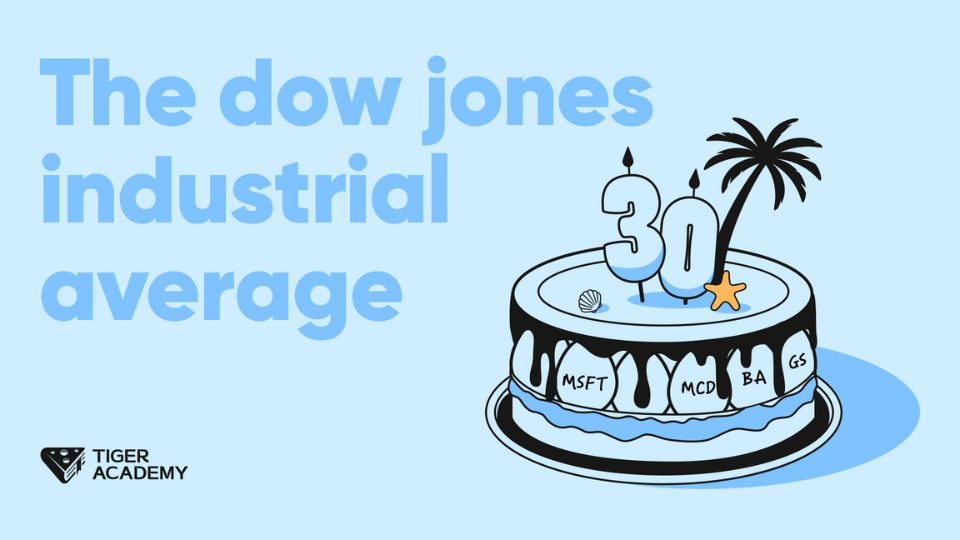
The Dow Jones Industrial Average has a history of more than 120 years, since it was introduced in 1896. It is the oldest of the three stock indices and one of the best-known stock indices in the world.

Here are 3 things I wish I knew about life and business at 23. For investors, this simply means: pessimism can work, from time to time. But over the long run — better on a brighter future is much, much, much better bet.
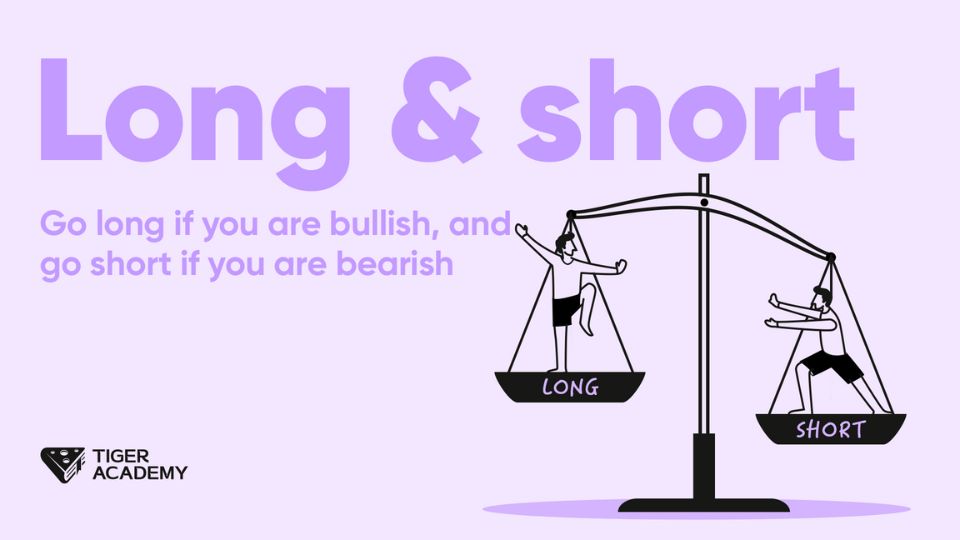
In stock trading, it is common to refer to investors who hold stocks as they are called long, while investors who do not hold stocks are called short. Those who buy stocks are called long, while those who sell them are called short.
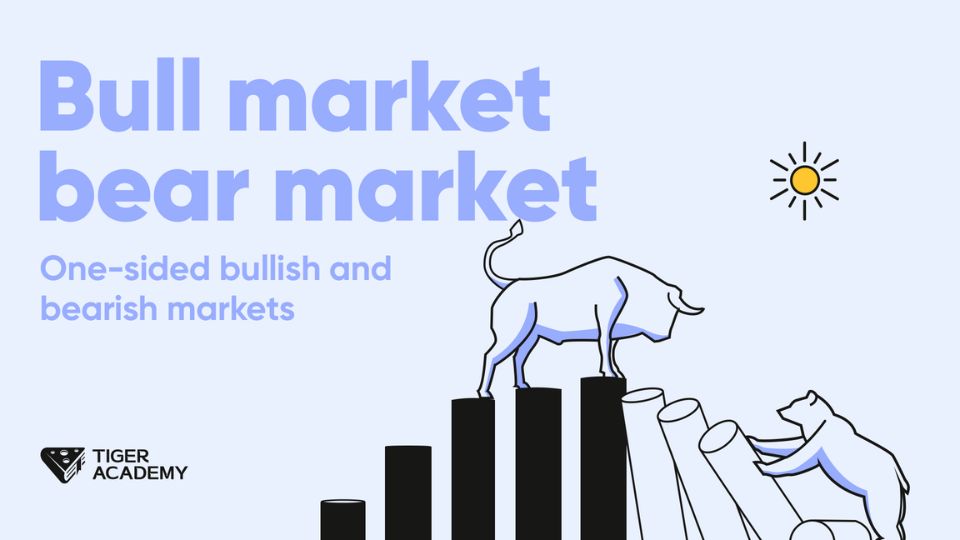
Strictly speaking, there is no clear distinction between bull and bear market indicators, generally as a description of the market trend of the concept.

We pull apart the remaining ASX shares from last week, including Cochlear Limited (ASX: COH), Macquarie Group Ltd (ASX: MQG) and more.
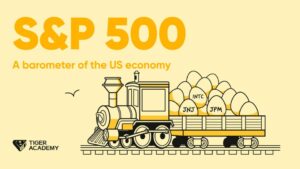
The S&P 500 index was compiled by Standard & Poor’s in 1957. It was originally made up of 425 industrial stocks, 15 railroad stocks, and 60 utility stocks, known as the S&P 500.

One key feature to watch out for is whether the company or ETF offers a DRP, or Dividend Reinvestment Plan. This is an option where you can choose to receive additional shares/units in your investment, rather than receiving a cash payment.

Whether this person is your partner, sister, friend from high school or that dude that works in IT, finding a handful of people to act as your accountability partners (your very own truth pod), is an important step in improving your decision-making skills and becoming a better investor.

There’s a lot of ways you can be led astray when it comes to investing, but one of your biggest battles will come from within. More specifically, I’m talking about those pesky things we call emotions.

The Dow Jones Industrial Average has a history of more than 120 years, since it was introduced in 1896. It is the oldest of the three stock indices and one of the best-known stock indices in the world.

Here are 3 things I wish I knew about life and business at 23. For investors, this simply means: pessimism can work, from time to time. But over the long run — better on a brighter future is much, much, much better bet.
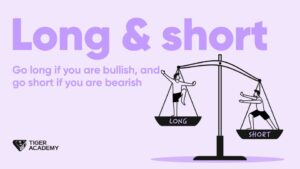
In stock trading, it is common to refer to investors who hold stocks as they are called long, while investors who do not hold stocks are called short. Those who buy stocks are called long, while those who sell them are called short.

Strictly speaking, there is no clear distinction between bull and bear market indicators, generally as a description of the market trend of the concept.
Want to level-up your analytical skills and investing insights but don’t know where to start? We can help. Join 40,000+ Australian investors on our mailing list today and we’ll send you our favourite podcasts, courses, resources, investment articles and podcasts every week. Delivered to your inbox every Sunday morning. Grab a coffee and let Owen and the team bring you the best investment insights every week.