FREE REPORT

FREE REPORt
3 high dividend yield stocks
That we recommend to nearly all of our clients

This excellent investment report was written by Luke Laretive, founder of Seneca Financial Solutions. Seneca holds an Australian Financial Service License (AFSL No. 492686) and is regulated by the Australian Securities and Investments Committee (ASIC). The information contained in this email is general in nature and does not take into account your personal situation. Please read our full disclaimer further down the page.
After more than a decade of experience providing strategic investment analysis and advice to some of the world’s leading organisations, I know get to spend my days working closely with my clients to design and implement specialised, personalised, multi-asset portfolios.
If you like my report on 3 ASX dividend shares, please send me an email or get in contact with me via our website. I love talking about companies and markets.
GQG Partners (ASX: GQG)
GQG was the top performing recommendation from the 2023 version of this report, generating investors 28.6% returns, +16.2% ahead of the wider market.
From a dividend investor perspective, you couldn’t have asked for much more, with GQG paying 13cps, which based on the $1.38 price the stock was trading on 1 Jan 2023, is a 9.42% dividend yield.
We update and reiterate our thesis for 2024.
| Share price | $1.69 |
| Market Cap (M) | $4,962m |
| Shares on Issue (M) | 2,953 |
| First Trading Date | 26 Oct 2021 |
| 52-Wk Range | $1.24 – $1.76 |
| PE (NTM) | 10.6x |
| Dividend Yield incl franking (%) | 8.9% |
| ROE (%) – LTM | 75% |
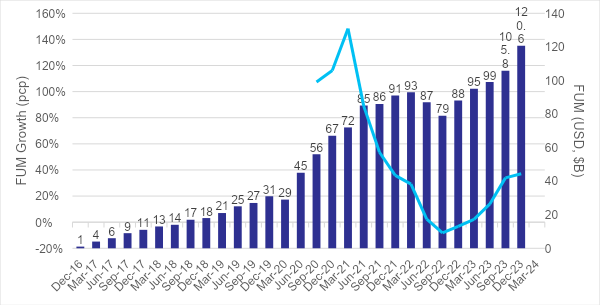
GQG Partners is a global fund manager focused on active global equity portfolios with US$120.6b in funds under management (as at end of December 2023). This has grown from only $10b at the end of 2017 and this growth has reaccelerated in recent quarters, to be running at 37% vs the same time last year.
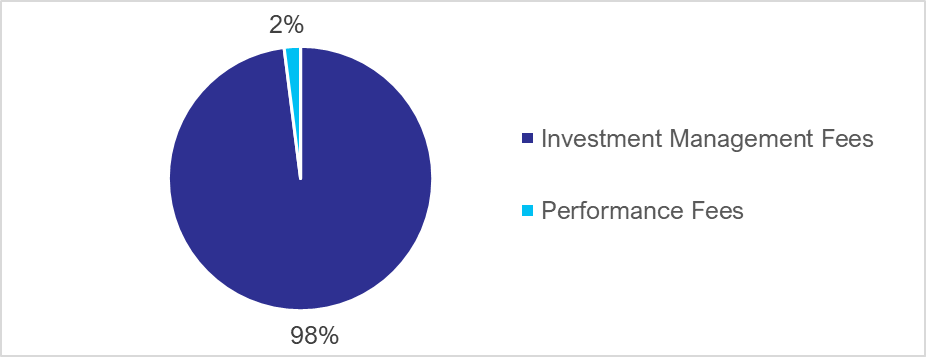
The business model is straightforward, they generate revenue through:
- Charging clients to manage their money (investment management fees)
- Charging performance fees (for outperformance)
GQG grow their profits through:
- Growing the money they currently manage (investment returns)
- Attracting more client money to manage (net inflows)
- Generating above-benchmark performance (performance fees)
As you can imagine, GQG incur some standard business costs such as salaries and bonuses to their staff, IT, commissions to referral partners and general & admin costs. Most of these do not grow as fast as fee revenue, and expenses like IT & SG&A largely remain fixed on a go-forward basis.
Why do we like it?
1. Founder owned and operated
GQG is led by the founders Rajiv Jain and Tim Carver, who have substantial investments in both the listed stock and the underlying products. Rajiv owns 68.8% of the company and Tim owns 5.6%, representing the vast majority of the co-founders’ net worth. The founders also reinvested 95% of the IPO proceeds into GQG strategies vesting over 7 years.
Employees have their bonuses paid by combination of cash and a deferred bonus invested into various GQG strategies subject to a 3-year vesting period, further aligning incentives.
2. Good at what they do
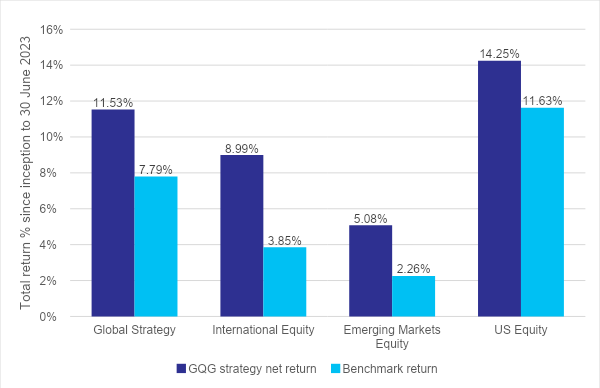
GQG has delivered impressive performance across their strategies since inception with its flagship Global Equity strategy delivering 11.53% per annum, outperforming its benchmark by 3.74% to 30 June 2023. Despite a mixed 2023, all 4 of their products have outperformed their respective benchmarks over 5 years, and since inception.
Historically, when fund managers generate strong returns, this leads to more clients seeking them out and existing clients allocating more money to GQG products. This is a tailwind for net inflows and subsequently, investment management fees. If the strong returns continue, as we expect, this will drive earnings and dividends higher.
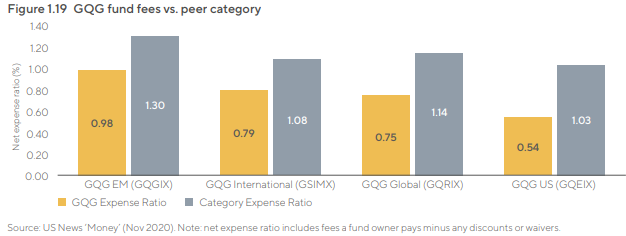
3. Competitive fees
Despite delivering excellent investment returns and outperforming their benchmarks consistently, GQG’s investment management fees compare very favourably to peers.
4. Marketing excellence
Rather than targeting individual investors, which would be a difficult and costly exercise, GQG has a highly effective distribution network. They target multiple distribution channels that are the ‘gatekeepers’ to valuable high net worth investors clients. The primary channels are:
- Institutional (50.8% of FUM): clients in this channel include insurance funds, pension/superannuation funds and sovereign wealth funds. The client segmentation for this channel is diverse with the Top 5 clients accounting for only 12% of FUM, while the Bottom 80% make up c.75%.
- Sub-advisory (34.9% of FUM): uses a financial ‘sponsor’, e.g., Goldman Sachs, to create the investment vehicle and manage the marketing and distribution. In its Sub-advisory segment, GQG is able to leverage the relationship of the sponsor to gain access to more than 1,000 sales professionals. This means GQG themselves don’t need to employ as many costly salespeople to access these potential clients.
- Wholesale (14.4% of FUM): this channel is focused on centralised and independent financial adviser networks and potentially is a large FUM growth driver for GQG.
5. Dividends!
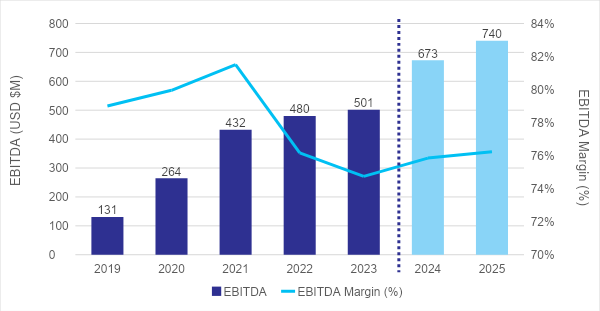
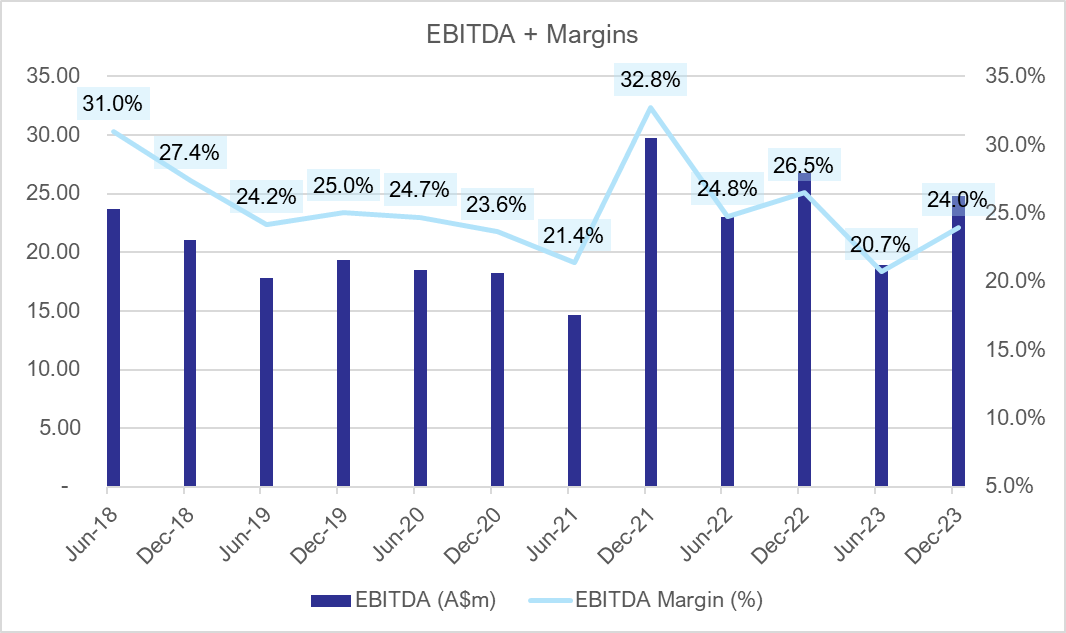
At Seneca, we love businesses that can maintain sustainably high margins. GQG operates on 75% EBITDA margins and as funds under management grows, we expect this will expand. Fund managers are largely fixed-cost operations, with only a portion of the cost base associated with incremental inflows and/or superior investment returns.
As a result, GQG can pay out a very high portion of its free cash flow in the form of dividends each quarter. In FY23 (GQG’s financial year end is Dec), GQG paid 13c of its 14c in earnings out as dividends. In FY24, consensus forecasts have GQG paying out 15c of its 16c in earnings.
Valuation
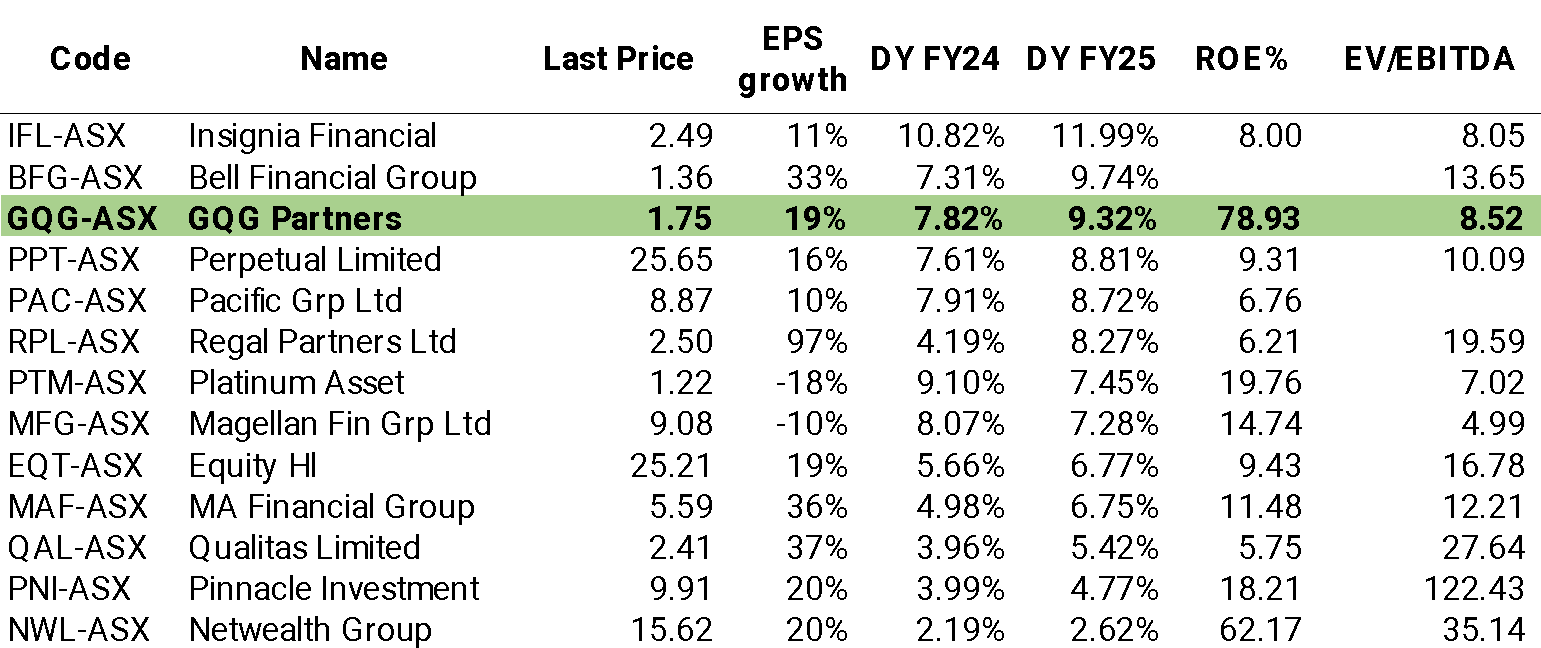
GQG is trading on a forecast (FY24) dividend yield of 8.9% and a PE of 10.6x and offering 19% earnings growth.
GQG offers a compelling valuation for a high-quality business with significant operating momentum.
6. What’s changed in 2024?
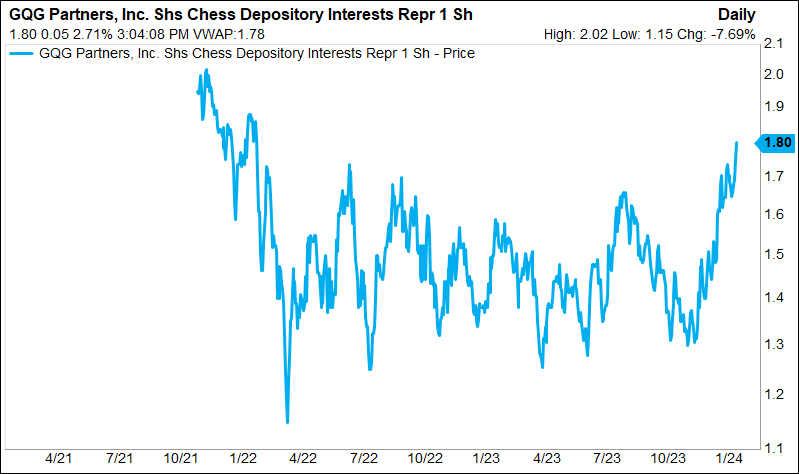
GQG featured in the news during the latter stages of 2023 as it announced a non-binding indicative offer (NBIO) to acquire Pacific Current Group Limited (ASX: PAC) for $11.00 per share. PAC is a multi-boutique asset manager and was formally known as Treasury Group. GQG is a major shareholder and was competing for PAC with River Capital Pty Ltd (another major shareholder).
PAC did not recommend either bid to its shareholders and has now concluded discussions with both parties.
PAC generated underlying EBITDA of $34.4m in FY23 on $50.2m in revenue. The shares continue to trade at $8.85, below the stated NAV of $11.92.
Monash IVF (ASX: MVF)
| Share price | $1.34 |
| Market Cap (M) | $522m |
| Shares on Issue (M) | 391 |
| First Trading Date | 30 June 2014 |
| 52-Wk Range | $0.94 – $1.40 |
| PE (NTM) | 17.0x |
| Dividend Yield incl franking (%) | 5.79% |
| ROE (%) – LTM | 8.1% |
| EPS Growth % (NTM) | 18.6% |
Monash IVF is an in vitro fertilisation (IVF) and related fertility services (egg/embryo freezing, genetic testing and counselling) specialist with ~20% market share in Australia and expanding operations in Asia, primarily Kuala Lumpur but also Singapore and Indonesia which are growth markets.
Why do we like it?
1. Stable demand creates defensive, reliable/predictable earnings (and dividends)
The assisted reproduction technology sector has experienced consistent demand since the first successful in-vitro fertilisation (IVF) cycle in 1978. Monash IVF is Australia’s second largest provider of these services, delivering approximately 20% of stimulated cycles in this country.
MVF’s strategy of remaining a science-driven, premium provider has prevailed, resulting in strong pricing power with EBITDA margins consistently in the mid-20s. Since the ACCC’s inquiry into success rates in the sector (2016), low-cost IVF operators have ceded market share to full-service providers (such as MVF), who now dominate with c.80% market share.
Patients have a high willingness to pay due to the significance of positive outcomes, and the process is high trust (often through referrals). MVF’s success rates have improved from 28% to 38% over the last 9 years and it is now the leader in success rates and other support functions (embryology, genetics).
2. Sector tailwinds to drive earnings (and dividend) growth
The IVF industry continues to experience favourable long-term structural tailwinds from:
- people waiting longer to have kids (lifestyle trend)
- more frequent instances of issues having kids (lower fertility)
which should support demand for IVF services to remain robust in the long run. The Fertility Society of Australia estimates that 1 in 6 Australian couples of reproductive ages suffer from infertility, yet only 50% seek medical advice.
Medicare data showed +17.1% YoY growth in total IVF cycles (fresh and frozen) in the year to 30 November 2023. IVF, like other healthcare service providers (radiology, pathology) has been slow to return to volume growth post-covid, but the sector appears to be well and truly back in growth mode.
Government policy is supportive of the IVF industry, with the 2023 Federal Budget revealing positive changes affecting MVF. Reproductive carrier screening was added to the Medicare Benefits Scheme (MBS) in November 2023, which makes it more affordable for parents to undertake genetic screening before undergoing IVF. MVF is well positioned to benefit, with an at-home genetic testing and PGT (Pre-implantation Genetic Testing) processes which should enjoy higher sales volumes and encourage incremental IVF cycles.
In a growing and underpenetrated market, MVF is likely to continue to build on its 20% market share, with acquisitions (PIVET, ART associates, Fertility North) and specialist recruitment underpinning our forecast c.150bps increase in market share during FY24.
3. Conservative Guidance & Dividends
MVF issued 1H24 guidance for $14.5m – $15.0m underlying NPAT which to our mind, suggests the potential for an earnings ‘beat’ at the full-year result.
Not only does this guidance imply ~17% year-over-year earnings growth at the midpoint, but that the company is tracking ahead of consensus estimates for earnings in FY24. Further, 2H23 was stronger than the first half, and growth initiatives (including acquisitions and market share gains) should further strengthen the second half result.
On the back of 100% conversion of EBITDA to pre-tax operating cash flows in FY23, the MVF board was able to declare a fully franked FY23 final dividend of 2.2 cents per share, taking the full year total to 4.4 cents per share. We expect this dividend has considerable upside in 2024.
4. Strategic interest in the IVF sector creates additional upside potential.
The IVF sector ticks a lot of boxes for private equity:
- a cash-generative, defensive, government-supported industry.
- reliable, growing revenues.
- high barriers to entry; and
- opportunities to consolidate.
MVF’s closest competitor Virtus Health was acquired by private equity firm CapVest in 2022, and another low-cost competitor, Adora was spun out of parent company Healius (ASX: HLS) in 2022 to new private equity owners Liverpool Partners. Private equity is notorious for aggressive cost-cutting methods, so presumably, this will make it harder for them to retain quality fertility clinicians and could benefit MVF with doctors and patients opting to take their business elsewhere.
The Virtus takeover at 12.4x EV/EBITDA provides a good yardstick for MVF, which trades at a discount, on 9.4x forward EV/EBITDA multiple, despite robust growth prospects, a better (less leveraged) balance sheet and a 4% fully franked dividend yield.
Genea was also acquired by Liverpool Partners for a price of $201.8 million, representing ~15x forward EBITDA or 16.4x trailing EBITDA, significantly above MVF’s current valuation.
Valuation
MVF looks undervalued in an absolute sense on 17x forward P/E and a dividend yield of 4.1%, fully franked. In a relative sense, if MVF traded at the valuation that Virtus was taken over at, MVF shares would have 31% upside. And that’s not including the upside we see from a potential earnings upgrade, beyond current market expectations…
Dexus (ASX: DXS)
| Share price | $7.60 |
| Market Cap (M) | $8,169m |
| Share price | $7.69 |
| Shares on Issue (M) | 1,076 |
| First Trading Date | 06 October 2004 |
| 52-Wk Range | $6.30 – $8.77 |
| PE (NTM) | 10x |
| Dividend Yield excl franking (%) | 6.6% |
| Price/Book Value | 0.67x |
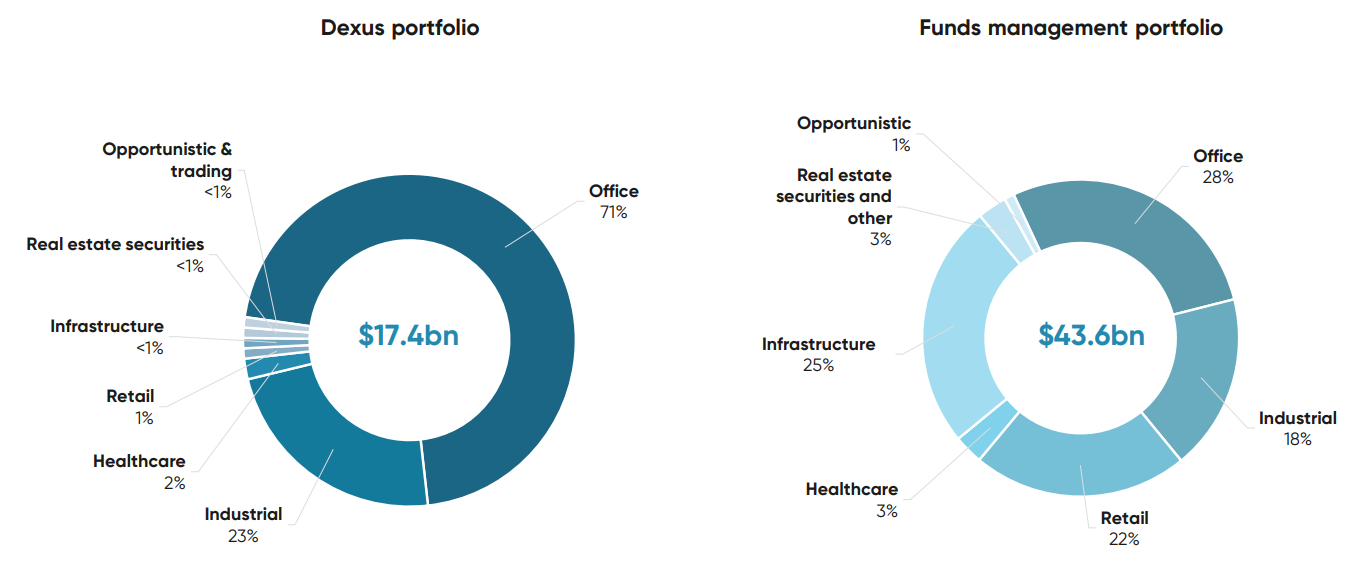
Dexus is an integrated real estate group, with $17.4 billion in Dexus-owned real estate assets, primarily comprised of offices in Australian capital cities as well as industrial property. Dexus also has a funds management portfolio with $43.6 billion in funds under management diversified across office, infrastructure, industrial, retail and other sectors.
Why do we like it?
1. High-quality, diversified property portfolio
Of the 23 REITs in the S&P/ASX 200 (INDEXASX: XJO), we believe Dexus’ portfolio to be among the highest in quality.
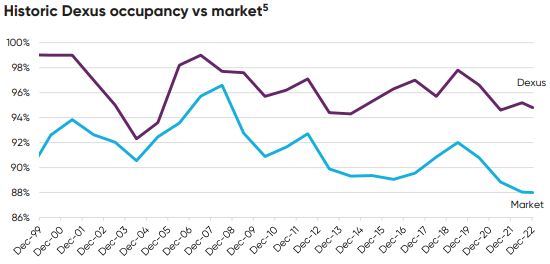
Dexus buildings are majority leased to blue-chip tenants with a weighted average lease expiry (WALE) of 9.7 years. Tier 1 property is more resilient to occupancy concerns and tenant stress and demonstrates quality and resilience with 99.6% rent collections, 95.9% office occupancy and 99.4% industrial occupancy achieved in FY23.
Despite the headlines about ‘the death of the office’, vacancy rates have remained stable at 14.4% over the last two years in Australian CBD’s – according to JLL Research. Dexus, due to the premium nature of its offices (think Atlassian Centre in Sydney, 80 Collins Street in Melbourne, 240 St Georges Terrace in Perth, 25 Martin Place in Sydney, and more), enjoys well above market occupancy rates of 95.9% vs the market at 85.6%.
Dexus also has a conservatively geared balance sheet at 27.9% vs peers in the range of 30-40%, better insulating it from financial stress that can get real estate investors into trouble. No debt maturities in FY23 and reduced FY24 maturities provide only modest exposure to the increase in funding costs being experienced across the sector.
2. Underappreciated funds management business highlights excessive discount to NTA
Dexus has a funds management arm that is, in our view, underappreciated by the market. With $43.6 billion of funds under management after completing the ~$18 billion acquisition of AMP’s Collimate Capital, Dexus has a range of scalable products that generate recurring revenue from management fees.
New growth initiatives such as the launch of Dexus’ first infrastructure fund in 2023 continue to drive value in the business. The Wholesale Airport Fund closed oversubscribed, exceeding the targeted $130 million capital raise and cleverly harnessing investor demand following the takeover of ASX stalwart Sydney Airport in 2021. Currently, the fund owns a 1% stake in Australia Pacific Airports Corporation (APAC), the unlisted holding company of Melbourne Airport and Launceston Airport.
On top of the funds’ management platform, Dexus has approximately $17.4 billion in on-balance sheet assets, primarily comprising premium office assets. Dexus carries a net debt of approximately A$5.0 billion.
DXS shares have plunged from $11.38 at the end of December 2021 to $7.69 in January 2024, a 32.5% decline. Presently, it stands at a 29.3% discount to the Net Tangible Assets (NTA) of $10.88 at 30 June 2023, with no apparent recognition of value attributed to the funds management business. The market is telling us that asset values are coming down, or share prices are too cheap. We think asset values may compress a little more, but not to the extent that the market is pricing.
To highlight the discount to book value, Dexus sold an A-grade office building at Sydney’s Maragaret Street for a price of $293.1 million in August 2023. Importantly, this was in line with the 30 June 2023 book value, meaning that through the continuous asset revaluation that occur each half, the Dexus’ updated book value proved to be an accurate and fair estimate of eventual realised value.
If the market does not recognise the value that DXS shares offer, we think the stock could be of potential interest to deep-pocketed real estate/private equity style acquirers such as Brookfield or Blackstone.
3. Beneficiary of plateauing/falling rates
The REIT sector has come under pressure in 2022/23 with steep interest rate hikes increasing the cost of debt funding that REITs are heavily reliant on to make a return on capital as well as valuing existing assets. Distribution yields also look relatively less attractive when you can get a 4%+ yield risk-free from a government bond.
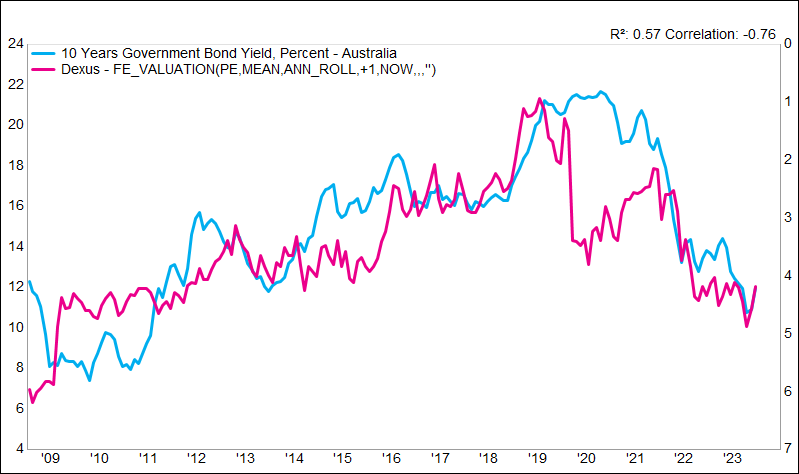
The combination of higher rates and the emergence of working from home post pandemic dampening demand for leased office space have caused the DXS share price to diverge from the broader market. However, we see this divergence as an oversold opportunity to buy into the established Australian property sector of the market at an attractive yield.
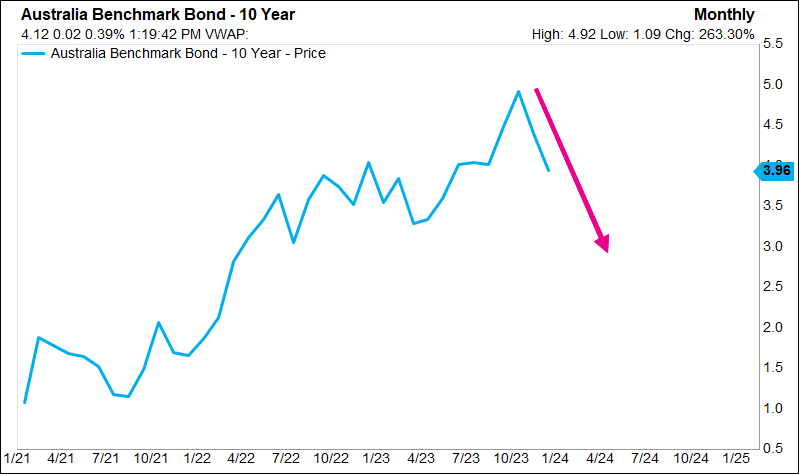
Excluding COVID-19 shock, the Dexus PE ratio (valuation) is highly correlated with the Australian 10y bond yield (inverted)
Since December 2022, Australian inflation data, as measured by the monthly Consumer Price Index, has cooled considerably from a high of 8.4% to 4.3% reported in November 2023. As a result, bond markets have priced in no more rate hikes from the RBA and even point to the possibility of rate cuts by late 2024.
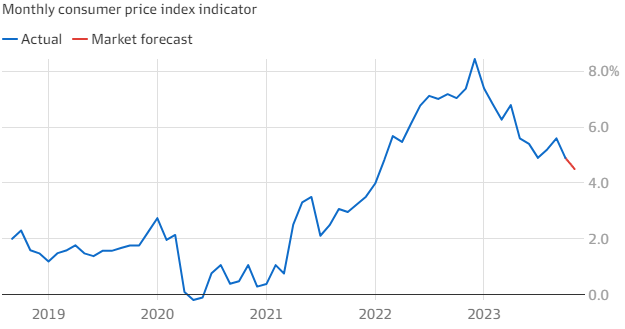
If we have seen peak interest rates, expect NTA discounts in the REIT sector to narrow across the board. Dexus trades at one of the highest discounts to book value within the sector.
4. Reliable dividends
Dexus has demonstrated a history of slowly growing dividends per share over time, through accretive developments, acquisitions, and rental increases across the portfolio. DXS typically pays an unfranked interim dividend in February alongside a partially ~20% franked final dividend in August.
Analysts are forecasting dividends for the next 3 financial years to be flat/down slightly going forward and therein lies the opportunity. We hold the contrarian view that as interest rates top out, occupancy proves more resilient in the office market, and inflation-linked rents support distribution growth, DXS can beat consensus dividend per share forecasts.
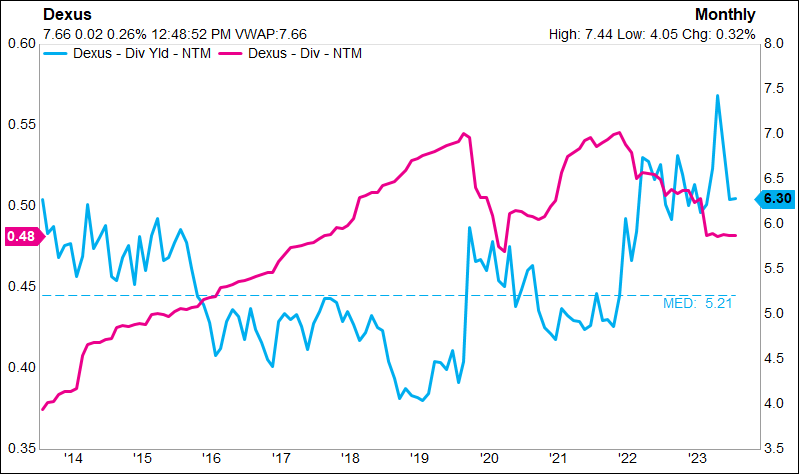
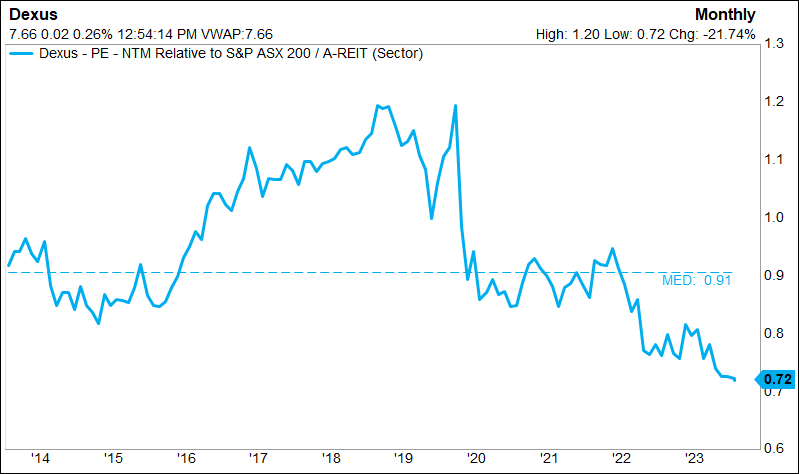
Valuation
DXS shares trade on a P/E of 10x (a substantial discount to its 16x historical average) and a 28% discount to peers’ vs long term average discount of 9%.) offering investors an adequate margin of safety at current levels.
The market is only valuing Dexus’ assets at c. 74c in the dollar (c. 26% discount to book value). This is inconsistent with pre-COVID, when DXS almost always traded at a premium to book value.
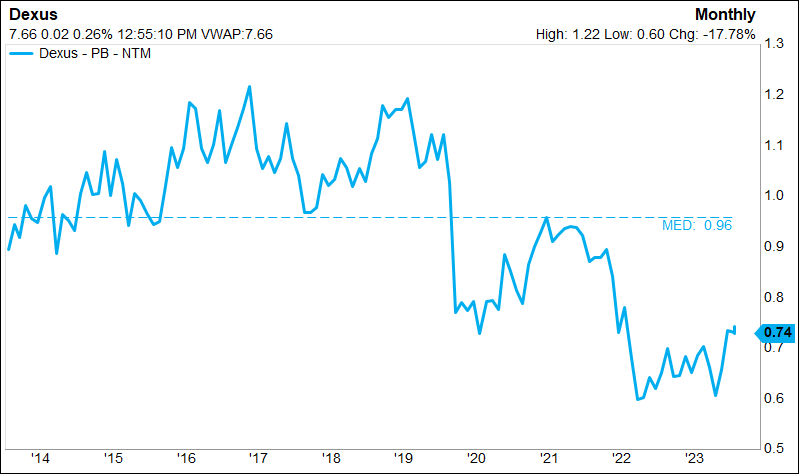
This attributes no value for the development pipeline and reflects a valuation for the funds management platform significantly below current asset values. We see these discounts normalising over the next 12-24 months, with declining bond yields to be a key catalyst (a trend that’s already emerged in 2024.)
Want more analysis on the shares in your portfolio?
Seneca Financial Solutions is a leading investment advisory, financial planning, and wealth management firm with clients around Australia.
Luke provides the RASK community a FREE initial consultation and portfolio review service, giving you an opportunity normally reserved for clients with more than $1m invested with us – to spend up to 30 minutes (via phone, video link or face-to-face) with our CEO and Investment Adviser, Luke Laretive.
Luke is happy to any questions you might have about individual shares, your portfolio, or Seneca’s latest investment opportunities. Luke and his team manage c. A$300m in client assets for some of Australia’s most successful business leaders, entrepreneurs, and families.
“As the CEO of one of Australia’s largest mining companies (New Hope Group) and having employed Luke in a previous role, I’ve been thrilled with the efficiency, capability and service-offering Seneca has been able to offer my SMSF. Relative to the conflicted banks and standard ‘stockbrokers’ they provide me with unique investment opportunities, considered financial advice and more importantly, really tailor their advice to my circumstances and investment preferences” -Rob Bishop, CEO, New Hope Corporation Ltd (ASX: NHC)
Get more of my best stock ideas for 2024
At Seneca, we do the hard work for you. As a free subscriber to my newsletter, you’ll begin receiving some of my research (e.g. my weekly update) for free.
Seneca’s Australian Shares strategy, which is a separately managed account (SMA), is a model portfolio available exclusively on the PraemiumSMA platform. What this means is, our team professionally manage the portfolio in-house at Seneca, but on your behalf.
The portfolio owns our best 20-40 companies from inside the S&P/ASX 200. As I explained recently on The Australian Investors Podcast with Owen Rask, unlike a traditional managed fund or ETF, our investors have full transparency on all portfolio holdings, transactions and receive dividends directly to their nominated bank account. After all, they are your shares.
You can send me an email right now if you have any questions about these stocks or my report. Alternatively, give our team a phone call on (03) 8639 1600.
If you would prefer to just ‘get on with investing’, you can apply to become a Seneca client with us by clicking here.
If you’d like access to our ALL our ideas in 2024, schedule a call with Luke today.
Finally, thank you so much for taking the time to read my report. You can expect to receive my investor newsletter going forward.
I’ll get back to finding great companies to buy.
Cheers!
Luke Laretive
GENERAL ADVICE WARNING
This report was written in January 2024. By the time you read it, some of the data points, or our view on the companies, may not be entirely accurate. You can call or email us for our latest view on the companies mentioned.
This investment report was written by Luke Laretive, founder of Seneca Financial Solutions. Seneca holds an Australian Financial Service License (AFSL No. 492686) and is regulated by the Australian Securities and Investments Committee (ASIC). The information contained in this email is general in nature and does not take into account your personal situation. You should consider whether the information is appropriate to your needs, and where appropriate, seek professional advice from a financial adviser.
Luke Laretive, Seneca Financial Solutions, its Directors and its associated entities may have or had interests in the companies mentioned. Although every effort has been made to verify the accuracy of the information contained in this email, all liability (except for any liability which by law cannot be excluded), for any error, inaccuracy in, or omission from the information contained in this email or any loss or damage suffered by any person directly or indirectly through relying on this information. Consensus data has been provided by Factset.