In this long-form article, the team at BetaShares ETFs answer questions about the BEAR range of ETFs and how to invest during Coronavirus.
Australian and international sharemarkets have been in turmoil for several weeks, with few portfolios unaffected and volatility at all-time highs. As a result, we’ve received many questions from investors relating to their ETF investments. We thought we’d use this post to provide answers to 4 of the most common:
- How have ETFs held up in the market meltdown?
- The S&P 500/NASDAQ etc. did +/-x % last night – why isn’t my ETF doing the same?
- I bought the BEAR ETF (ASX: BEAR) a week ago. The market has fallen 10% – why has my ETF not gone up by 10%?
- Will your Bear funds still be able to operate if the government brings in a ban against short-selling?
Featured video: ETF update with Betashares
1. How have ETFs held up in the market meltdown?
At various times in the past, concerns have been raised that ETFs have not been tested in rapidly falling markets. People had been concerned that, as a whole lot of investors rush for the exit, liquidity would dry up. Well, the test has well and truly presented itself!
If I want to sell, will there be a buyer?
Over the last few weeks, ETF trading volumes have increased dramatically, as shown in the table below. Since 24 February, average daily trading volume in ETFs has been almost 8 times the average daily trading volume during 2019. The significant increase in trading levels has demonstrated the liquidity of ETFs, and helps ETF investors increase their confidence they will be able to exit their investment, or purchase their chosen product, as and when required.
| Average Daily Trading Volume | 2019 Average | 24 Feb to 16 March 2020 |
x times over 2019 Average |
| ASX ETFs | 58,485,699 | 461,424,177 | 7.9 |
Source: IRESS
Bear in mind also that ETF issuers appoint market makers who provide prices at which you can trade. Beyond their contractual terms, it is in the interests of market makers to continue to provide their services even in the tough times. This is because they are compensated by the volume of trading they do, not the direction of that trade, and so benefit from increased trading levels in both falling and rising markets.
Will I get a fair price?
By ‘fair price’, we mean a price that is close to ‘true value’ or net asset value (NAV). For a market maker to provide prices, they need to know the value of the ETF’s underlying assets.
The challenge in the current environment is that there are more ‘unknowns’ than usual – and uncertainty means risk. Where there is uncertainty around the value of a fund’s underlying assets, there is a flow-on effect to the pricing of the ETF. It’s important to understand that this is a consequence of what is happening in the market for the underlying assets – not of the ETF as an investment vehicle.
So, for example, pricing of Australian equities ETFs has generally remained close to NAV, even in these extraordinary times. This is because, while volatile, the underlying securities remain highly liquid, and there is transparency and clarity around share prices. As such, market makers are easily able to price ETFs and continue to offer competitive bid-offers to investors.
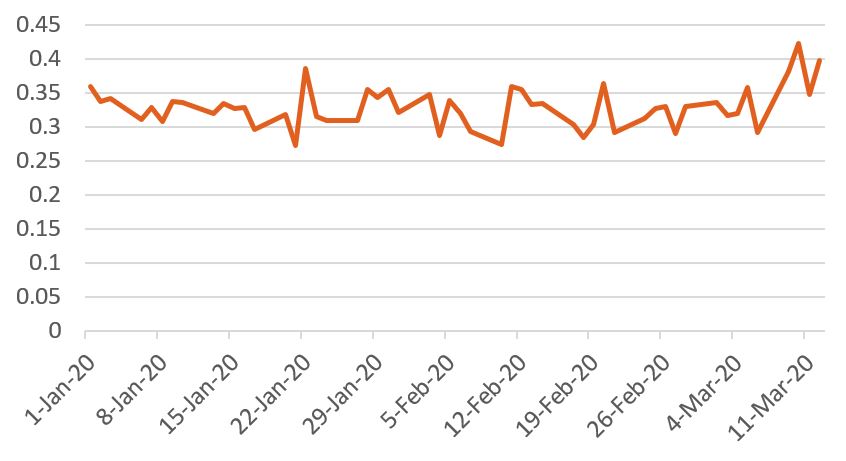
The chart below shows the average “spread” between bid and ask prices on 34 Australian equities ETFs (including some from BetaShares and other issuers), from 1 January 2020 to 12 March 2020. You will see that spreads only rose slightly for these ETFs towards the end of this period, which is a fairly remarkable achievement given the volatility we have encountered.
Average bid-ask spread, Australian share ETFs (%)

Source: Bloomberg
When it comes to fixed income or international ETFs, there is more uncertainty around the underlying assets. Establishing prices on some bonds, for example, has been challenging. International shares trade in a different time zone, introducing further uncertainty.
The pricing of these ETFs reflects that uncertainty, meaning that spreads between buy and sell prices have widened over what investors would normally expect. Again, however, it should be stressed that this is a consequence of uncertainty in the underlying markets, rather than of the inherent structure of ETFs. In other words, the liquidity provided to you as an investor in a fixed income ETF was likely significantly more than an investor seeking to trade the underlying fixed income securities themselves.
Ultimately, an ETF is as liquid as the underlying market. And the volatility of the price of an ETF will reflect the volatility of the assets the ETF holds.
2. The S&P 500/NASDAQ etc. did +/-x % last night – why isn’t my ETF doing the same?
Holders of an ETF over, for example, the S&P 500 Index or NASDAQ 100 Index, may read that the index moved x% overnight, only to find that this move is not matched in the price of the ETF when trading starts on the ASX. Why is this so?
The reason for this lies in the fact that, in order to give the most accurate ‘pricing’ of an international ETF which is trading when an underlying stockmarket is closed, futures prices are used. Futures prices are used because futures markets operate around the clock even when those exchanges are closed.
For example, U.S. equities markets close at 4pm New York time. Australian markets don’t open until 4 hours later (3 hours during daylight saving). During this period, U.S. futures markets continue to trade and it is these futures prices that are used to determine the ‘fair value’ of an international ETF during our trading day.
In these turbulent times, a lot can happen in three hours, leading to significant moves in futures prices. At ASX market open, the market makers for international ETFs will set their opening prices with reference to the relevant futures market, as it is the best indicator of fair value while equities markets are closed.
Movements in futures prices can be even greater over the weekend, as futures markets continue trading even while equities markets are closed.
Another contributing factor to price movements in unhedged funds is currency fluctuations. With currency markets particularly volatile at the moment, changes in the value of the AUD can significantly affect the value of your international ETF, even while the foreign equities market itself is not trading.
Movements in futures prices and currencies also explain why the price of an international ETF can move during the Australian trading day, even though the overseas equities market is closed.
Read more about dealing with timezones.
3. I bought BEAR a week ago. The market has fallen 10% – why has my ETF not gone up by 10%?
Investors looking to protect their portfolio from market declines may have invested in one of our short funds, which seek to generate returns that are negatively correlated to the returns of the S&P/ASX 200 Index, or, in the case of the US Equities Strong Bear Hedge Fund, the S&P 500 Index (hedged to AUD).
Importantly, each fund aims for a gearing/exposure range as outlined below on a day to day basis. However, it should not be expected that the return over a longer period will necessarily fall within the target range.
| Fund | ASX code | Target portfolio exposure |
| Australian Equities Bear Hedge Fund | BEAR | -90 to -110% |
| Australian Equities Strong Bear Hedge Fund | BBOZ | -200 to -275% |
| U.S. Equities Strong Bear Hedge Fund | BBUS | -200 to -275% |
Portfolio exposure, or the gearing ratio, changes on a daily basis as the market moves. As markets fall, your initial capital increases in value which means the gearing ratio declines. As markets rise, your initial capital decreases in value which means the gearing ratio increases.
These day-to-day moves affect the outcome over a longer period of time. In addition, the funds are rebalanced when market movement causes their gearing to reach the outer end of the target range, which can have an effect on long term outcomes.
The other point to note is that the short funds achieve their exposure by selling futures contracts. The return from the Bear funds will, therefore, relate more closely to movements in futures than to movements in the cash equities market. This is particularly relevant to the U.S. Strong Bear Hedge Fund and the timing issues outlined in Question 2 above.
In the case of our Australian Bear Hedge Funds, trading in ASX SPI 200 futures contracts closes each day at 4.30 pm, whereas the closing level of the S&P/ASX 200 Index is calculated around 4.15 pm. In normal circumstances, there would typically be little movement during this period – but in current market conditions, 15 minutes is a long time!
To illustrate, the table below shows daily movements in the S&P/ASX 200 Index, the ASX SPI 200 futures contract, and the NAV of BEAR, between 6 March and 13 March 2020. You can see that the daily percentage changes in the NAV are very close to 1:1 with movements in the futures contract, while there is more variability in returns compared to movements in the cash equities index.
| Date | Closing value S&P/ASX 200 | % change | Closing value, ASX SPI 200 | % change | Closing NAV, BEAR | % change |
| 6/03/2020 | 6216.2 | 6178.00 | $12.61 | |||
| 9/03/2020 | 5760.6 | -7.3% | 5677.00 | -8.1% | $13.58 | 7.7% |
| 10/03/2020 | 5939.6 | 3.1% | 5935.00 | 4.5% | $12.96 | -4.5% |
| 11/03/2020 | 5725.9 | -3.6% | 5698.00 | -4.0% | $13.52% | 4.3% |
| 12/03/2020 | 5304.6 | -7.4% | 5244.00 | -8.0% | $14.59 | 7.9% |
| 13/03/2020 | 5539.3 | 4.4% | 5564.00 | 6.1% | $13.71 | -6.0% |
| % Change, 6/3 – 13/3 | -10.9% | -9.8% | 8.8% | |||
The key message here is that the short funds target a return over a one-day period, and should not be relied upon to generate exactly that return over a period of longer than one day.
This discussion applies equally to BetaShares’ geared funds.
Here’s where you can read more about the BetaShares BEAR funds.
4. Will your Bear funds still be able to operate if the government brings in a ban against short-selling?
Australian investors may well remember a few occasions on which the government banned short selling of securities in an attempt to curb market volatility. With volatility once again at very high levels, there are some observers who are wondering whether such a ban may soon be applied again.
While it is not our place to opine on the validity or otherwise of such a ban, it is important to understand that our Bear funds do not actually achieve their investment objective by short selling securities. Instead, they short equity futures (such as the SPI 200 futures for BEAR and BBOZ and S&P 500 futures for BBUS). As such, any short-selling ban would be highly unlikely to extend to futures which are considered an important part of the market environment particularly as they are used significantly by institutional investors for hedging purposes.
This article was written by Betashares ETFs, you can learn more about BetaShares and view their range of ETFs
on their website.
[ls_content_block id=”14948″ para=”paragraphs”]


